Contouring
"I really like the automatic gridding link to Surfer!"
--David Dahlstrom, Barr Engineering
AQTESOLV works automatically with Surfer (v 6 or higher) to generate contour plots of drawdown, recovery and groundwater mounding.
How It Works
Contouring results in AQTESOLV is as easy as 1-2-3! Just follow three simple steps in the Grid Wizard and AQTESOLV displays a contour plot using Surfer. It's that easy!
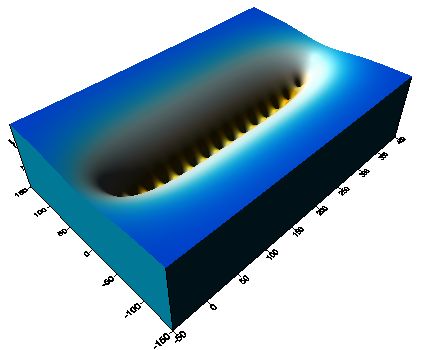
Create custom 2-D (areal or cross-sectional) and 3-D (surface) contour plots for more effective presentation of pumping test and groundwater mounding results to colleagues, clients and regulators.
Surfer is a powerful, general-purpose software package from Golden Software that is popular among geoscientists and engineers for contouring any type of environmental data such as elevations of groundwater or surface water, thickness of geologic units or floating product, and concentrations in groundwater, soil or air. Thus, one software package can meet all of your contouring needs.
Examples