Diagnostic Flow Plots
Only AQTESOLV provides a set of powerful diagnostic plots that aid in the selection of appropriate aquifer models and solutions methods for your pumping test data.
Diagnostic plots display field data on transformed axes and help you to identify important flow regimes such as
- infinite-acting radial flow
- wellbore storage
- fracture flow
- channel flow
- spherical flow
A key diagnostic on these plots is the identification of unit (1:1) slopes on double-logarithmic (log-log) axes.
Radial Flow Plots
Radial flow plots are useful diagnostic tools for identifying infinite-acting radial flow conditions, wellbore storage and closed aquifer behavior.

- On a semi-log radial flow plot, late-time data exhibiting a straight line are indicative of radial flow conditions in an infinite-acting aquifer.
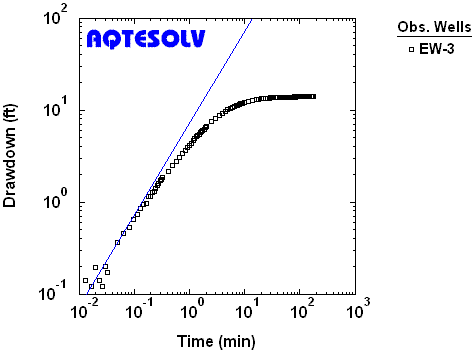
- On a log-log radial flow plot, early-time data exhibiting a unit slope are indicative of wellbore storage, an important flow regime to consider in the interpretation of single-well tests (Figure 1).
- On a log-log radial flow plot, late-time data exhibiting a unit slope are indicative of a closed aquifer (an aquifer enclosed by no-flow boundaries).
Linear Flow Plots
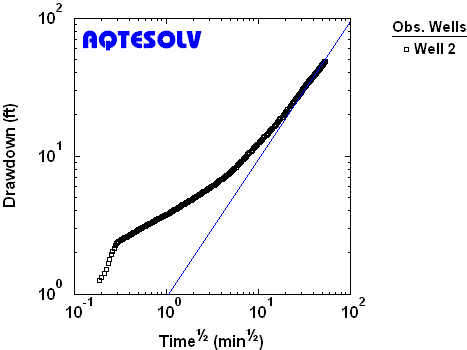
Linear flow plots are useful diagnostic tools for identifying linear flow behavior in single fractures and channel aquifers. The linear flow plot transforms the time scale by its square root.

- On a log-log linear flow plot, early-time data exhibiting a unit slope are indicative of linear flow conditions to a single fracture with infinite conductivity or uniform flux along the fracture.
- On a log-log linear flow plot, late-time data exhibiting a unit slope are indicative of linear flow in a channel aquifer.
Bilinear Flow Plots
Bilinear flow plots are useful diagnostic tools for identifying fracture flow behavior, flow in dikes or flow in a channel aquifer with permeable walls.
- On a log-log bilinear flow plot, early-time data on exhibiting a unit slope are indicative of bilinear flow to a single fracture with finite conductivity.
- On a log-log bilinear flow plot, late-time data exhibiting a unit slope are indicative of bilinear flow in a permeable dike surrounded by less permeable country rock or linear flow in a channel aquifer with permeable walls.
Spherical Flow Plots
Spherical flow plots are useful diagnostic tools for identifying spherical flow conditions such as may occur in the vicinity of a partially penetrating well.
- On a linear spherical flow plot, data exhibiting a negative unit slope are indicative of spherical flow conditions.