Design of a Constant-Rate Pumping Test in an Unconfined Aquifer
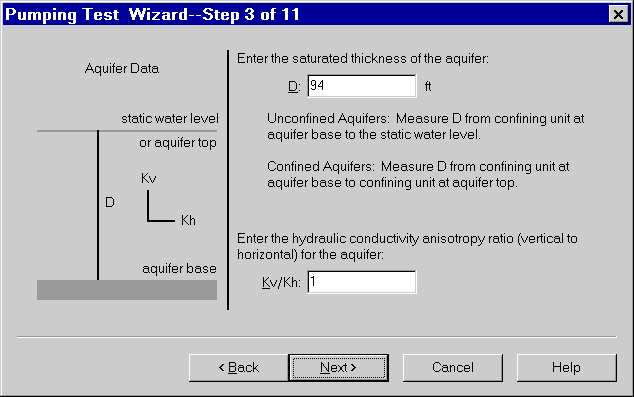
This tutorial shows you how to use AQTESOLV to design a pumping test in an unconfined aquifer. In the example, a partially penetrating test well pumps at a constant discharge rate of 750 gallons-per-minute (gpm). Drawdown is monitored in a partially penetrating observation well screened near the water table and located 82 feet (ft) from the test well. The thickness of the aquifer is 94 ft.
Start the AQTESOLV application (v3 or higher) and follow the steps below.
- Choose File>New and select Pumping Test Wizard from the list to create a new data set for a pumping test. Click OK to proceed with the Pumping Test Wizard.
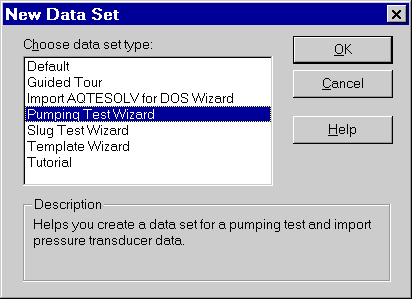
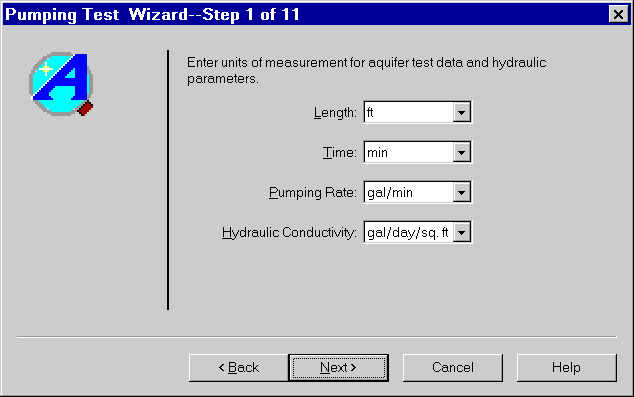
- Enter units of measurement as shown and click Next.
- Click Next to skip the step for project information.
- Enter aquifer data as shown and click Next.
- Click Next twice to skip the steps for fractured aquifer data.
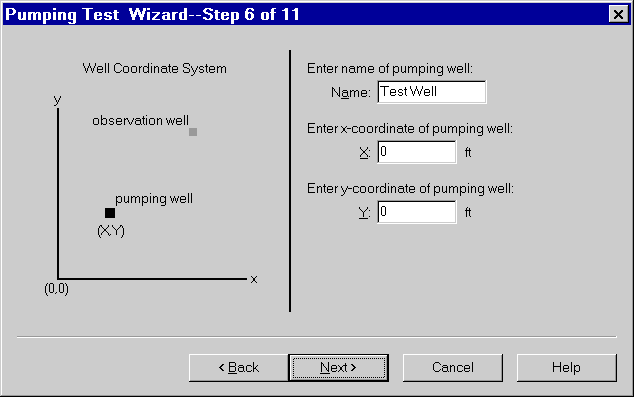
- Enter pumping well information as shown. The default X and Y coordinates place the pumping well at the center of the coordinate system. Click Next.
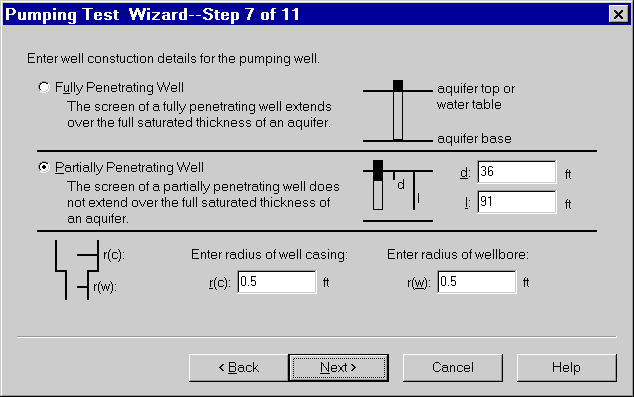
- Choose the option for a Partially Penetrating Well, enter depths as shown, and click Next.
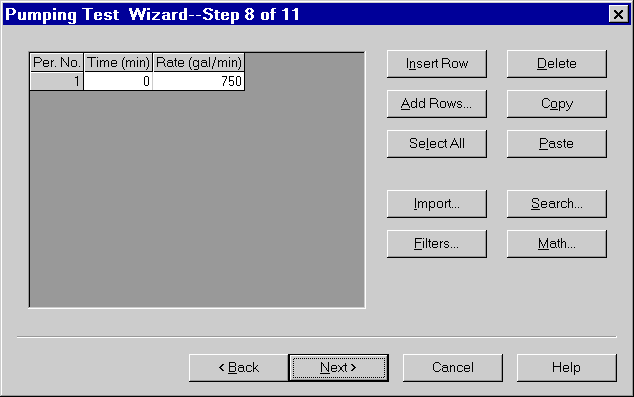
- Enter pumping rate data in the spreadsheet as shown. Click Next.
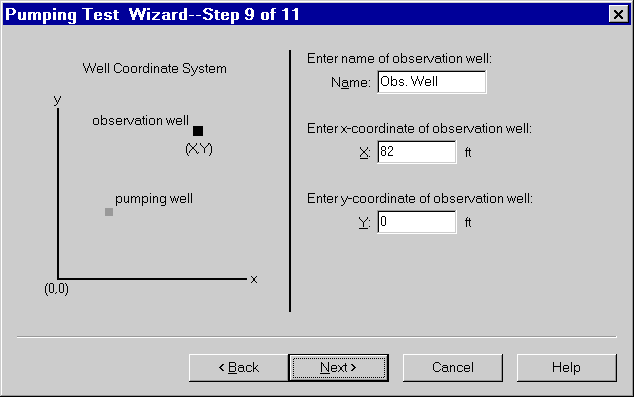
- Enter observation well data as shown and click Next.
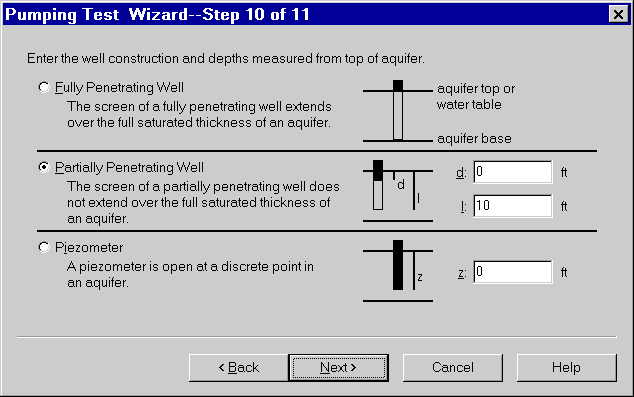
- Choose the option for a Partially Penetrating Well, enter depths as shown, and click Next.
- Enter two pairs of time and displacement into the spreadsheet to define the duration of the test and the range of displacement for plots. The exact values that you enter are not important; you can change the range of the x and y axes later. Click Next to continue.
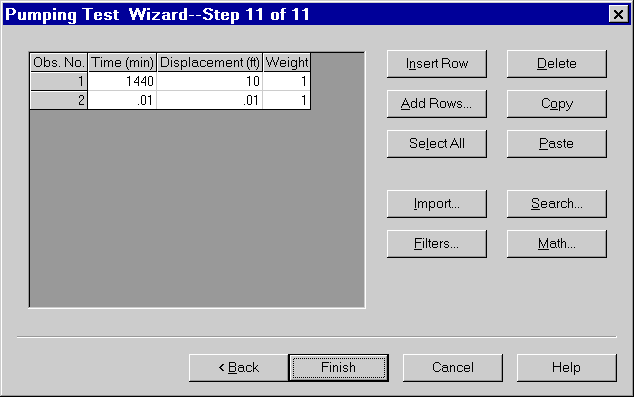
- Click Finish to complete the Pumping Test Wizard.
- If you entered all of the data into the Pumping Test Wizard correctly, the Error Log displayed on the screen should show no errors in the data set. If the Error Log identifies any mistakes, you can correct them by choosing options from the Edit menu.
- Choose File>Save As to save your work. Choose a folder and enter Neuman Forward Solution for the name of the file. AQTESOLV saves the data set with an .aqt extension.
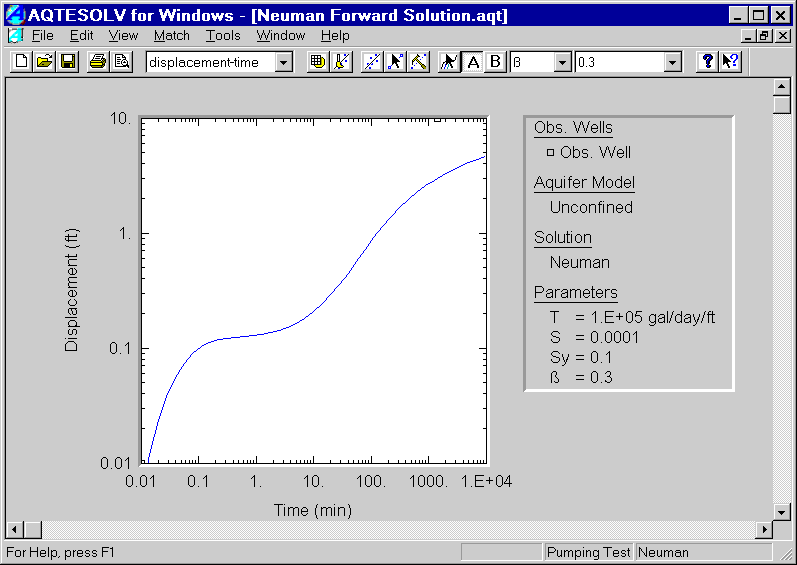
- Choose View>Displacement-Time to display the Neuman type curve on a plot of displacement as a function of time. Right click the mouse over the plot and select Log to display the plot with log-log axes.
- Choose Match | Toolbox and click Parameters to enter aquifer properties for the Neuman solution. Enter the following estimated values for the parameters: T=100,000 gal/day/ft, S=0.0001, Sy=0.1 and β=0.3.
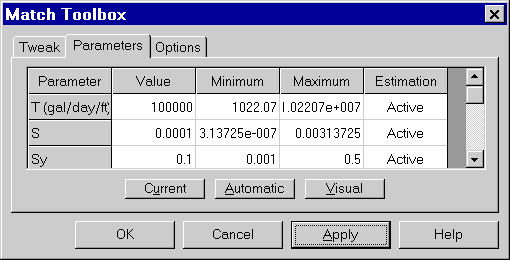
Click Apply to update the position of the type curve.
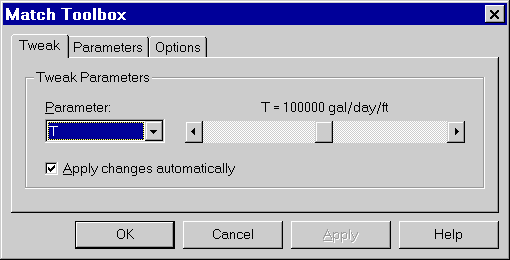
- Click the Tweak tab in the Match Toolbox dialog to perform interactive sensitivity analysis. For example, select T in the Parameter list and slide the tab on the scroll bar to adjust the transmissivity value. AQTESOLV automatically updates the type curve on the screen so you can view the effect of parameter changes.
 Click here to view a plot that benchmarks the Neuman solution in AQTESOLV against WTAQ, a program from the USGS developed by Barlow and Moench (1999).