Forward Solution (Wellfield)
This example shows you how to use AQTESOLV to perform a forward solution (predictive simulation) for a hypothetical wellfield with three production wells extracting water from a nonleaky confined aquifer.
Start the AQTESOLV application (v4 or higher) and follow the steps below. While following the steps in this example, click Help or press F1 to obtain context sensitive help in the AQTESOLV application.
Create a New Data Set with Forward Solution Wizard
The first step in performing a forward solution is to create a new AQTESOLV data set. In this example, we will use the Forward Solution Wizard to assist us with data entry.
- Create a new data set by choosing New from the File menu.
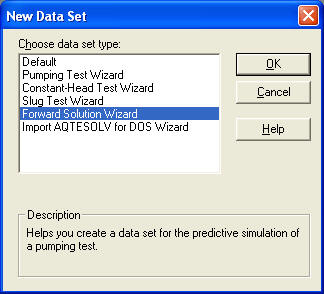
- In the New Data Set dialog, select Forward Solution Wizard from the list. Click OK.
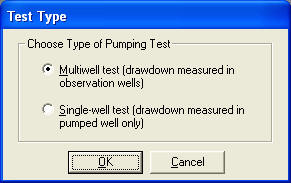
- Choose Multiwell Test for the type of test. Click OK.
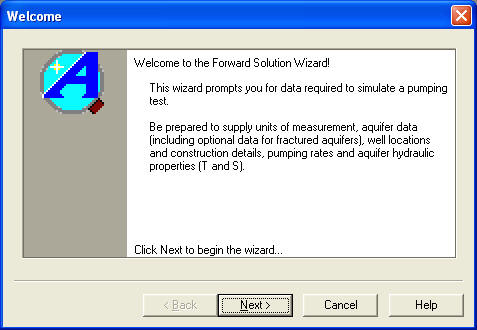
- The Forward Solution Wizard prompts you for data required for a forward solution (i.e., predictive simulation). Click Next to begin the wizard.
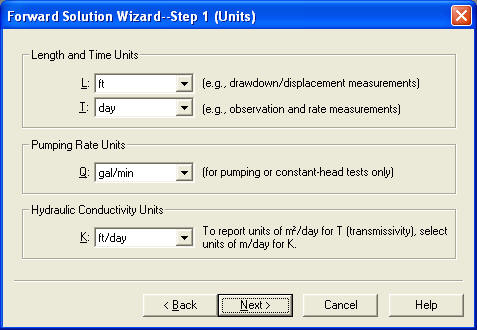
- For units of measurement, choose ft for length, days for time, gal/min for pumping rate and ft/day for hydraulic conductivity. Click Next.
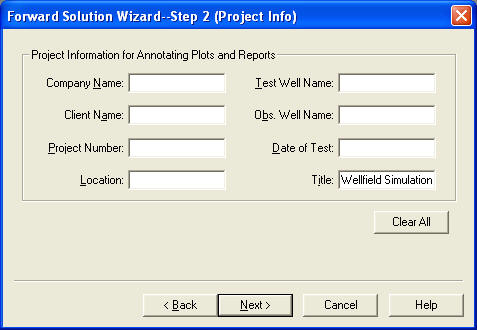
Tip: Click the Help buttons at any time to get context-sensitive help. - For project information, enter Wellfield Simulation for the title and click Next.
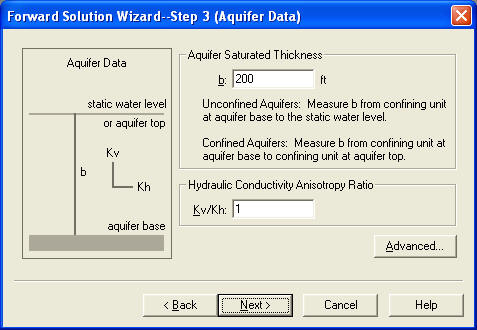
- For aquifer data, enter 200 for aquifer thickness and 1 for hydraulic conductivity anisotropy ratio. Click Next.
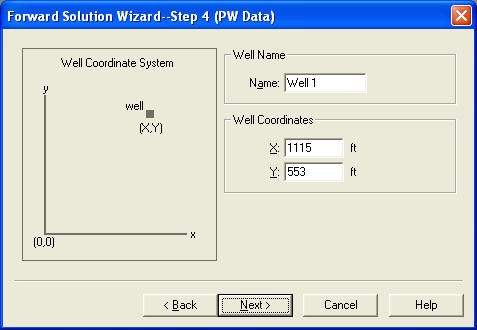
- For pumping well data, enter Well 1 for the well name. Enter 1115 and 553 for the X and Y coordinates, respectively. Click Next.
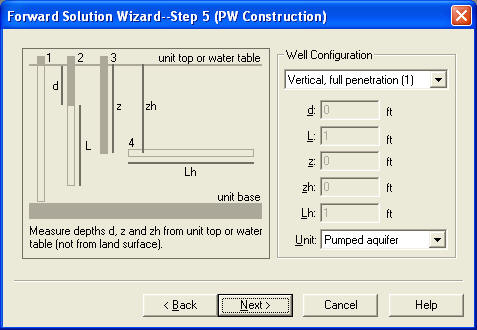
- For pumping well construction, select the option for vertical, full penetration. Click Next.
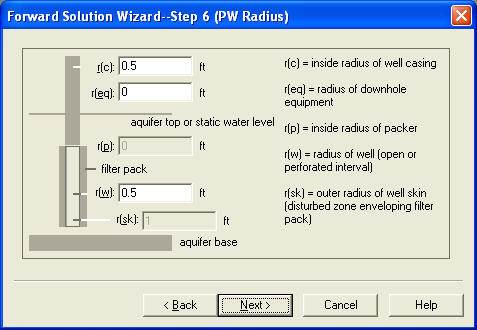
- For pumping well radius data, enter 0.5 for casing radius and 0.5 for well radius. Click Next.
- For pumping rates, enter 0 for time and 1000 for rate in the first row of the spreadsheet. Click Next.
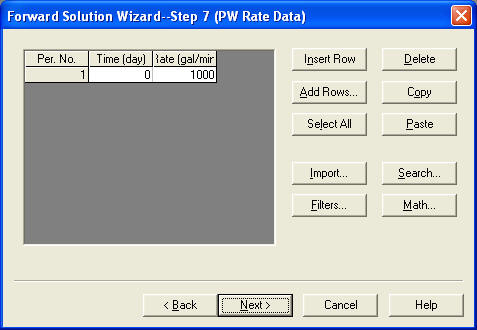
Tip: The rate that you entered (1000 gpm) will start at time t=0 and continue indefinitely. - For observation well data, enter MW 1 for the well name. Enter 10 and -50 for the X and Y coordinates, respectively. Click Next.
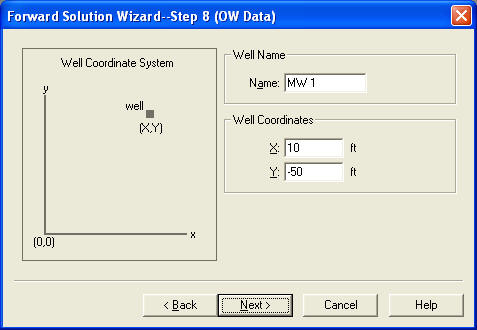
Tip: Use one or more observation wells in a forward solution to monitor drawdown over time. - For observation well construction, select the option for vertical, full penetration. Click Next.
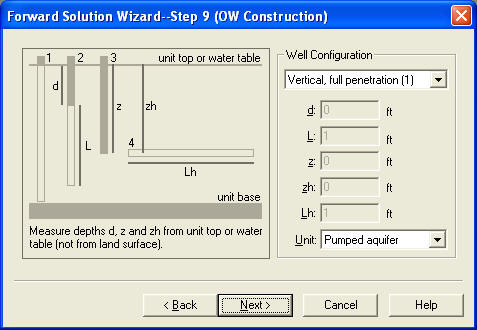
- For observation well radius data, enter 0.0 for casing radius and 0.167 for well radius. Click Next.
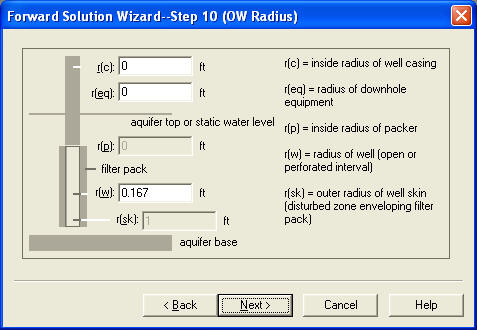
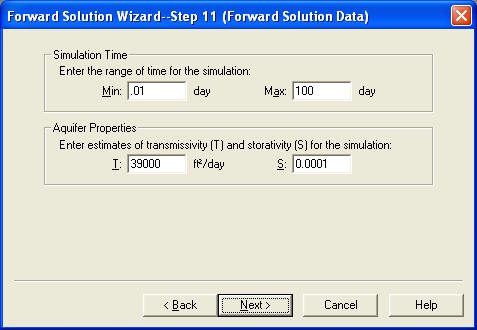
- For forward solution data, enter 0.01 and 100 for minimum and maximum time, respectively. Enter 39,000 and 0.0001 for the estimates of T (transmissivity) and S (storativity), respectively. Click Next.
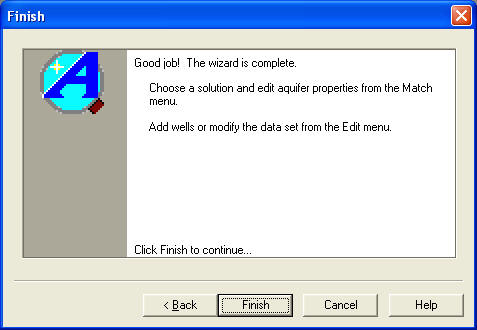
Tip: You can change aquifer properties later by choosing Toolbox from the Match menu. - You have completed the Forward Solution Wizard. Click Finish.
After completing the Forward Solution Wizard, AQTESOLV automatically displays an Error Log to let you know if the data set contains any errors. If the Error Log identifies any mistakes, choose options from the Edit menu to correct them. You may ignore an error reporting Number of Observations < 2 which only applies to performing a pumping test curve-matching analysis.
Save Data Set
At this point, it's a good idea to save your work.
Save the data set by choosing Save As from the File menu. Choose a folder and enter Wellfield for the name of the file. Click Save. AQTESOLV saves the file with an .aqt extension.
Add Wells to Data Set
The Forward Solution Wizard helped you enter data for one pumping well and an observation well. Now you will add the two additional pumping wells to the data set.
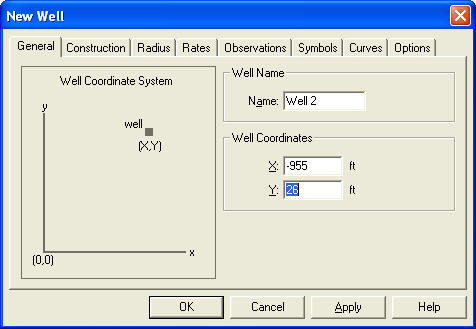
- Choose Wells from the Edit menu and click New to add a new well. Select the new well in the list and click Modify to edit the well.
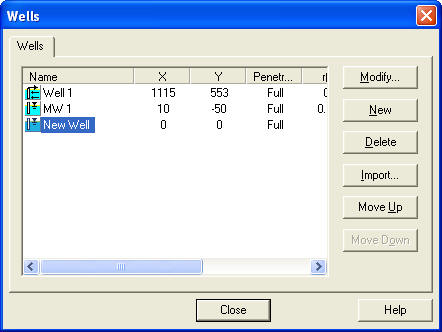
- In the General tab, enter Well 2 for the well name. Enter -955 and 26 for the X and Y coordinates.
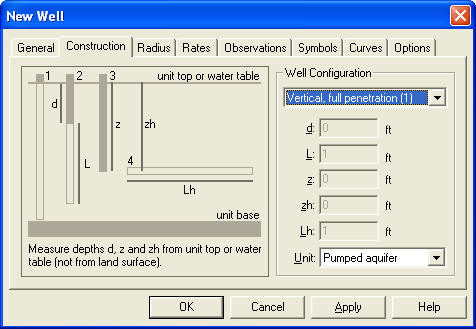
- In the Construction tab, select the option for vertical, full penetration.
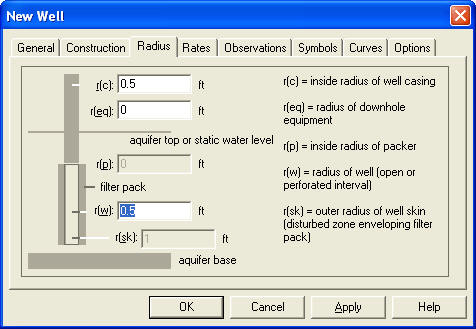
- In the Radius tab, enter 0.5 for casing radius and 0.5 for well radius.
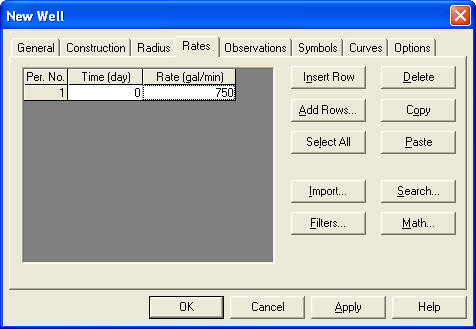
- In the Rates tab, enter 0 for time and 750 for rate in the first row of the spreadsheet.
- Click OK to close the dialog for the new well.
- In the Wells dialog, click New to add another well. Select the new well in the list and click Modify to edit the well.
- In the General tab, enter Well 3 for the well name. Enter 67 and ‑723 for the X and Y coordinates.
- In the Construction tab, select the option for vertical, full penetration.
- In the Radius tab, enter 0.5 for casing radius and 0.5 for well radius.
- In the Rates tab, enter 0 for time and 600 for rate in the first row of the spreadsheet.
- Click OK to close the dialog for the well.
- Click Close to close the Wells dialog.
- Choose Save from the File menu to save your work.
Predict Drawdown
Now that you've entered all of the well data into your data set, you can choose an appropriate pumping test solution to predict drawdown in the aquifer.
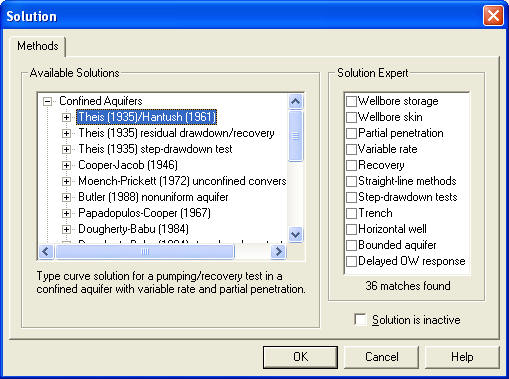
- Choose Solution from the Match menu to select an appropriate aquifer model. Remove the check from Solution is inactive. Click the + next to Confined Aquifers to expand the list of available solutions for confined aquifers. Select Theis (1935)/Hantush (1961) and click OK.
- Choose Displacement-Time from the View menu to show a drawdown plot.
- Choose Log Axes from the View menu to switch to log-log axes.
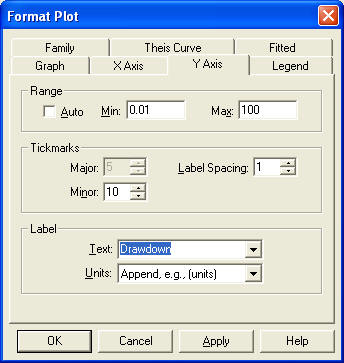
- Choose Format from the View menu and click the Y Axis tab. Remove the check from Auto and enter 100 for the Max value. Select Drawdown for the text of the axis label. Click OK.
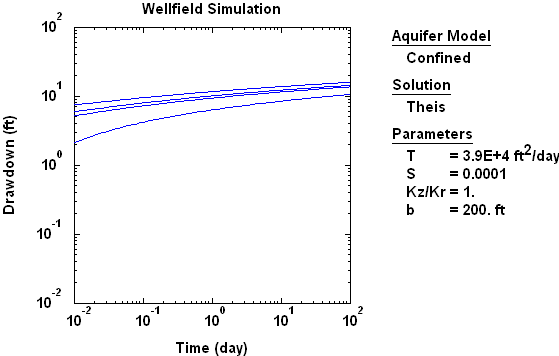
- The plot on the screen displays drawdown curves for the three pumping wells and the observation well. The properties of the aquifer (T and S) are shown in the legend to the right of the plot.
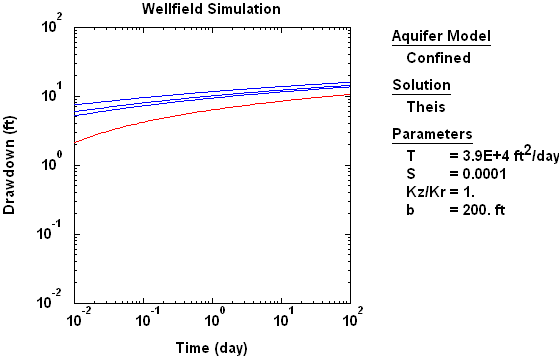
- Choose Wells from the Edit menu. Select MW 1 and click Modify. In the Curves tab, click Color for the type curve properties. Click OK. Click Close.
Tip: Move your mouse over the plot to track time and drawdown in the lower left corner of the window.
View Contour Plot
If you have Surfer installed on your computer, you may use the Grid Wizard to prepare a contour plot of drawdown for the wellfield.
- Choose Contour from the View menu.
- In Step 1 of the Grid Wizard, enter Wellfield.grd for the name of the file to store grid data for the contour plot. Select X-Y (Plan) for the grid orientation. Click Next.
- In Step 2 of the Grid Wizard, enter -1500 and 1500 for the minimum and maximum dimensions in the X and Y directions. Enter 100 for the number of grid lines for both directions. For the depths, enter 0 and 200 (i.e., compute the average drawdown over the full thickness of the aquifer). Enter 30 for the time. Click Next.
The number of grid lines affects the resolution and smoothness of contours. When possible, have grid lines intersect at each pumping well in your contour grid. Increase the number of gridlines to better represent cones of depression/impression around pumping wells and/or make contours look smoother. Avoid using more grid lines than needed for a desired result.
- In Step 3 of the Grid Wizard, check Display grid file with Surfer and select Contour if your have Surfer installed on your computer. Enter Wellfield.dat for the name of a file to contain posting data and check Add well data to posting file. Click Finish to create the grid file and (optionally) display the contour plot with Surfer.
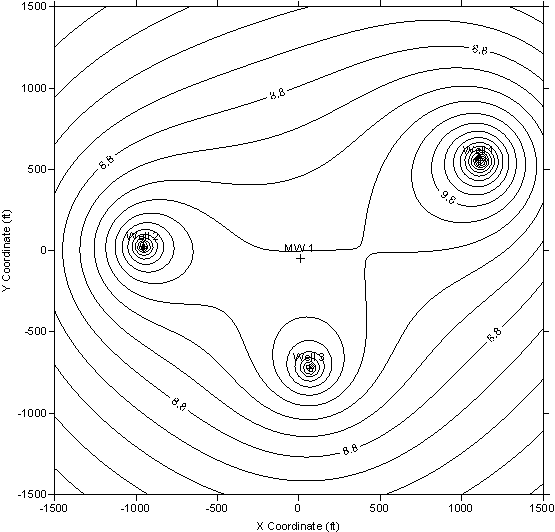
Tip: Use options in Surfer to customize the appearance of the contour plot.
Don't have Surfer? Use the free trial version of 3DField instead! After downloading and installing 3DField, utilize the Grid Wizard as described above to create a grid (.grd) file (but don't check the option to Display grid file with Surfer). Next start the 3DField app, choose Open from the File menu and select the grid (.grd) file that you generated with AQTESOLV. Follow the prompts in 3DField to create a 2D contour plot of drawdown (e.g., color fill contours).
Change Aquifer Properties
You may use AQTESOLV to predict drawdown response for a range of aquifer properties instead of just one set of values.
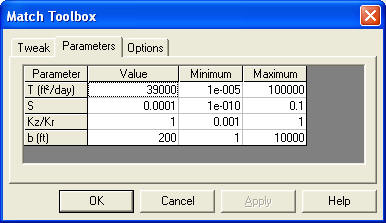
- Choose Toolbox from the Match menu.
- In the Tweak tab, select a parameter to change and use the slider to adjust its value.
- In the Parameters tab, enter new values for parameters. The minimum and maximum values entered in the Parameters tab also control the range used for parameter tweaking in the Tweaking tab.
Want to learn more? Contact HydroSOLVE, Inc. for customized training on the use of AQTESOLV for aquifer test analysis and predictive simulation.