Analysis of a Variable-Rate Pumping Test in a Confined Aquifer
If you have AQTESOLV v4.0 or higher, you should perform an updated version of this tutorial found in the Quick Start chapter of the Help file installed with the software.
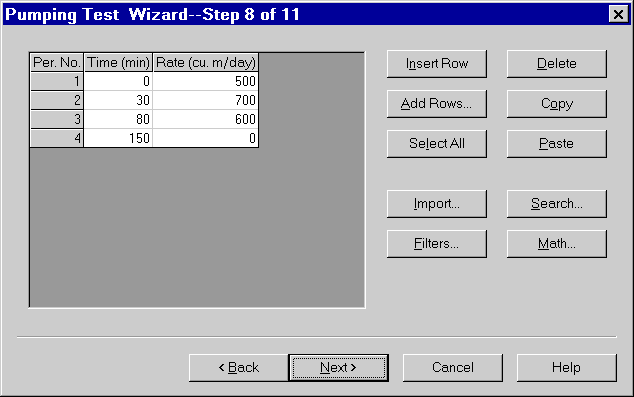
Kruseman and De Ridder (1990) presented data for variable-rate pumping test in a 25-m nonleaky, isotropic confined aquifer of infinite areal extent. A fully penetrating production well began pumping at rate of 500 m3/day. After 30 minutes, the rate was increased to 700 m3/day. The rate was decreased to 600 m3/day after 80 minutes since pumping began. Finally, the test was terminated after 150 minutes of total pumping time and recovery was monitored.
Start the AQTESOLV application (v. 3.0 or higher) and follow the steps below.
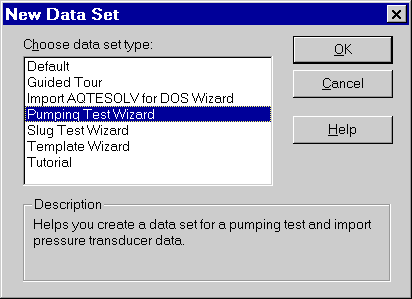
- Choose File | New and select Pumping Test Wizard from the list to create a new data set for a pumping test. Click OK to proceed with the Pumping Test Wizard.
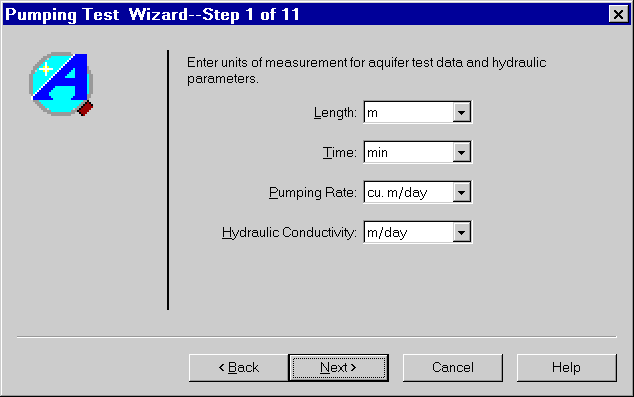
- Enter units of measurement as shown and click Next.
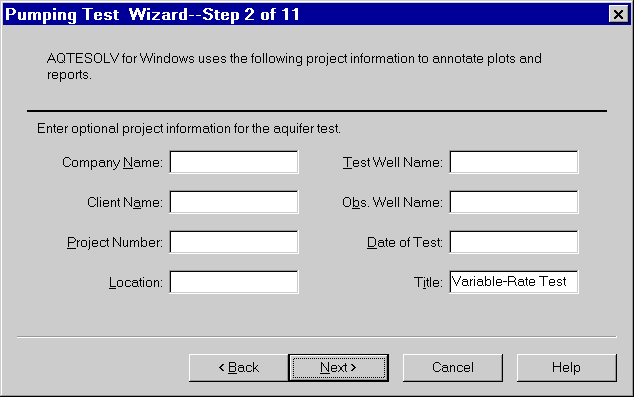
- Enter project information as shown and click Next.
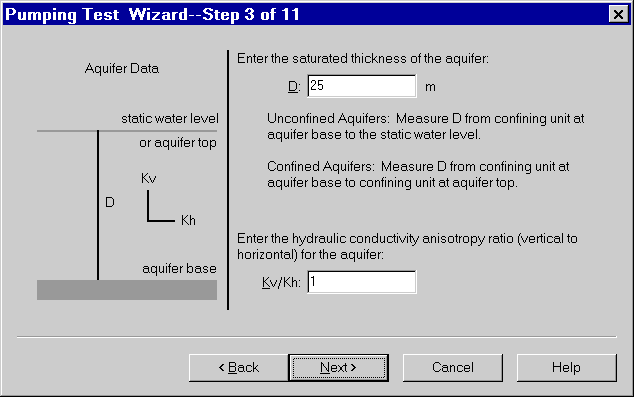
- Enter aquifer data as shown and click Next.
- Click Next twice to skip the steps for fractured aquifer data.
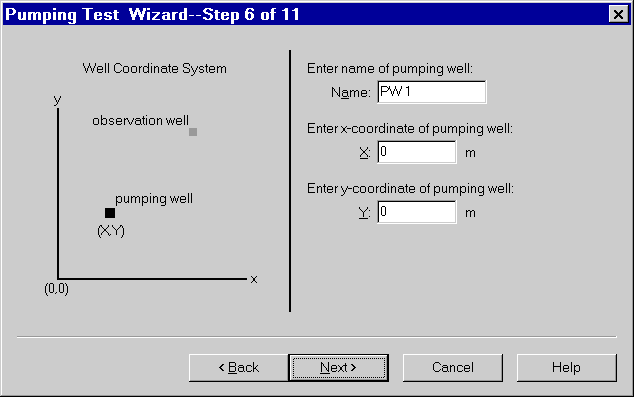
- Enter pumping well information as shown. The default X and Y coordinates place the pumping well at the center of the coordinate system. Click Next.
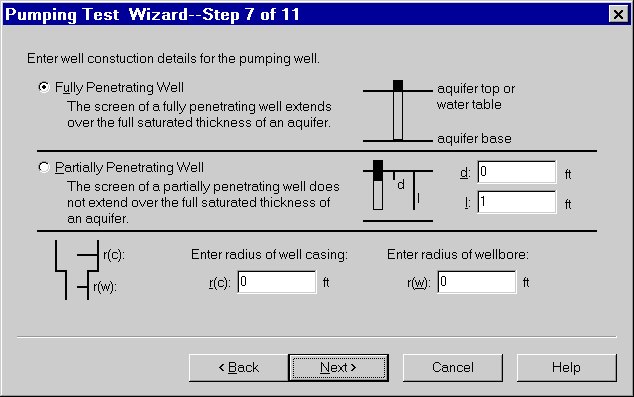
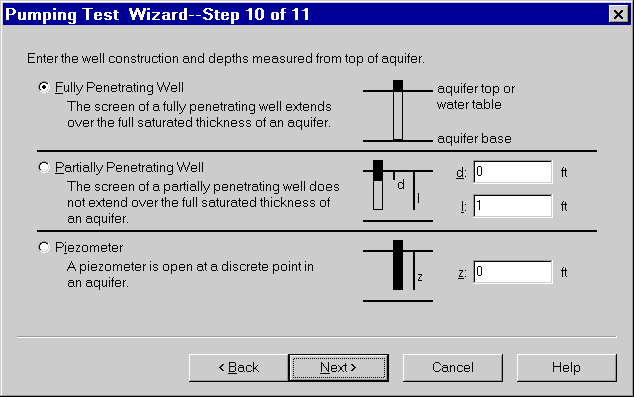
- Choose the option for a Fully Penetrating Well as shown and click Next.
- Enter pumping rate data in the spreadsheet as shown. You only need to enter a new pumping rate with the rate changes. Click Next.
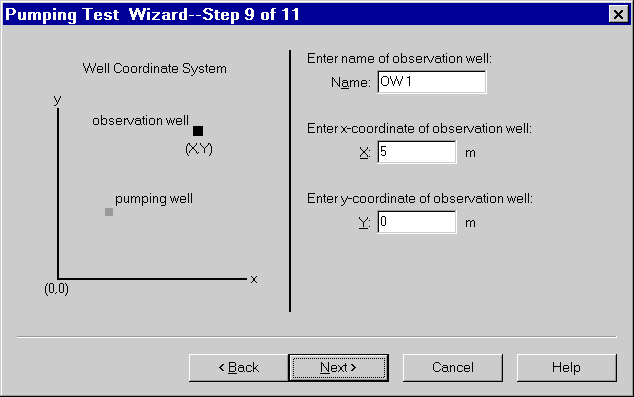
- Enter observation well data as shown and click Next.
- Choose the option for a Fully Penetrating Well as shown and click Next.
- Enter the following time and displacement measurements into the spreadsheet for observation data. You can copy the data shown below and paste it into AQTESOLV using the Windows clipboard. Note that time measurements for recovery data recorded after 150 minutes are entered as time since pumping began.
5 1.38
10 1.65
15 1.81
20 1.93
25 2.02
30 2.09
35 2.68
40 2.85
45 2.96
50 3.05
55 3.12
60 3.18
70 3.29
80 3.38
90 3.13
100 3.15
110 3.17
130 3.23
150 3.29
151 2.38
155 1.65
160 1.34
175 0.95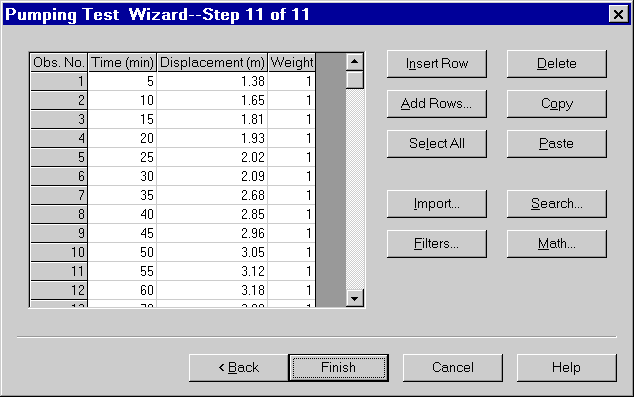
- Click Finish to complete the Pumping Test Wizard.
- If you entered all of the data into the Pumping Test Wizard correctly, the Error Log displayed on the screen should show no errors in the data set. If the Error Log identifies any mistakes, you can correct them by choosing options from the Edit menu.
- Choose File | Save As to save your work. Choose a folder and enter Variable-Rate Example for the name of the file. AQTESOLV saves the data set with an .aqt extension.
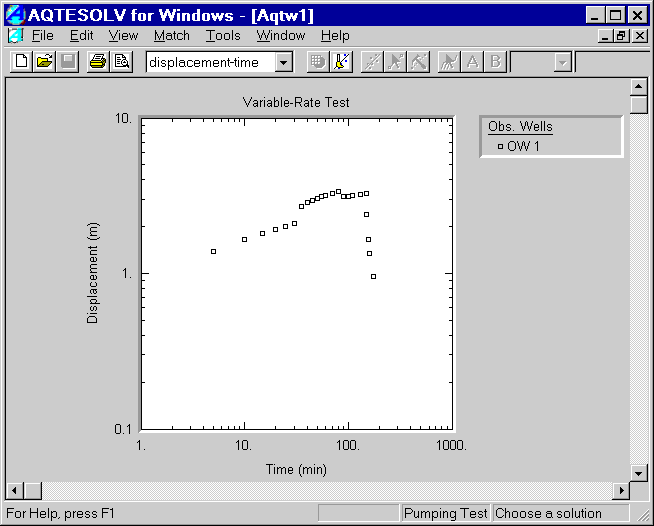
- Choose View | Displacement-Time to view a plot of the data.
- Choose Match | Solution and select Confined - Theis (1935) from the list. Click OK. AQTESOLV displays the Theis solution on the plot. Note that the initial estimates determined by AQTESOLV produce a reasonable match.
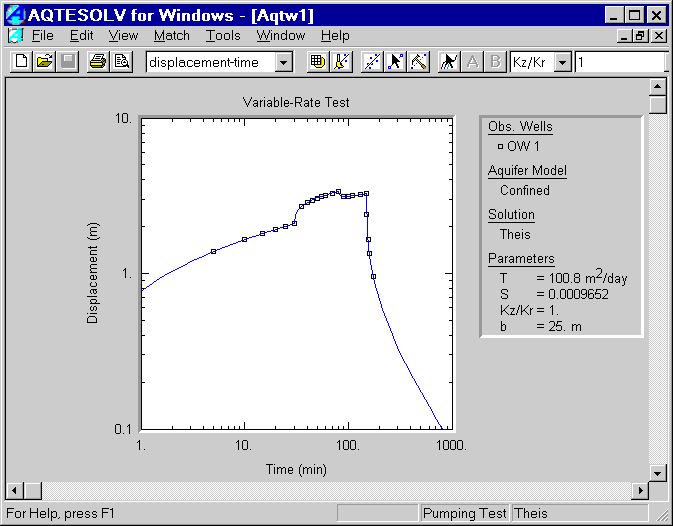
- Choose Match | Automatic and click Estimate to estimate aquifer properties using automatic estimation. When the estimation procedure has finished, click OK and then Close to close the summary window. Click OK to view the new position of the type curve with the estimated values of T and S.
- Choose Match | Visual if you would like to perform visual curve matching. For tests with variable pumping rates, visual curve matching is most effective with the Active Type Curves option activated on the toolbar. Move the mouse over the plot. Click and hold the left mouse button down to drag the type curve to a new location.