Slug Tests
by Glenn M. Duffield, President, HydroSOLVE, Inc.
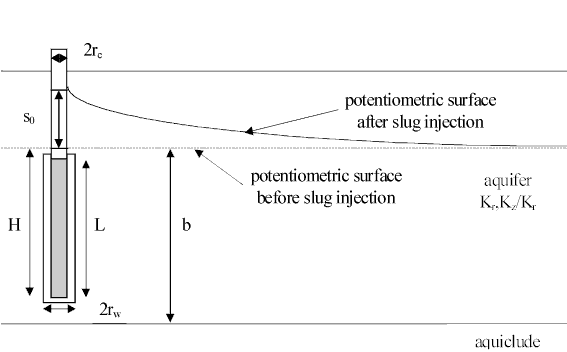
The slug test method is a popular and inexpensive means of estimating the hydraulic properties of aquifers (primarily hydraulic conductivity, K).
Confined Aquifer Methods
Methods for analyzing slug tests in confined aquifers include Cooper et al. (1967), Hvorslev (1951) and Hyder et al. (1994). Strictly speaking, the Bouwer and Rice (1976) solution is intended for unconfined aquifers; however, Bouwer (1989) pointed out that the same solution method also should give reasonable estimates of K in confined aquifers. A study by Brown et al. (1995) tested the applicability of the Bouwer and Rice solution to confined conditions. Based on the cases studied in their work, the Bouwer-Rice solution yielded superior estimates of K compared to the Hvorslev solution for partially penetrating wells in confined aquifers.
Unconfined Aquifer Methods
Slug test analysis methods for unconfined aquifers include Bouwer and Rice (1976) and Hyder et al. (1994). For the same reason that Bouwer (1989) found that the Bouwer and Rice method has application to both confined and unconfined aquifers, we may also extend the use of the Hvorslev (1951) method from confined to unconfined aquifers in many cases. According to Brown et al. (1995), the upper boundary condition appears to have very little effect on the estimate of K except when the top of the well screen is close to the boundary (a point made by Bouwer [1989] as well). Therefore, we can expect that application of the Hvorslev solution with an appropriate shape factor for a partially penetrating well will yield reasonable K estimates for an unconfined aquifer when the water table is not close to the top of the well screen.
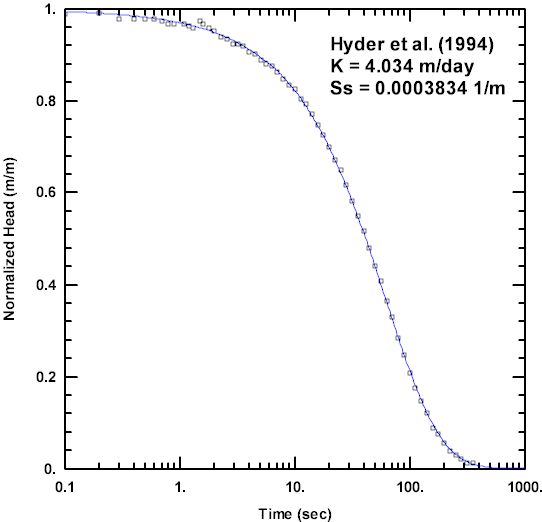
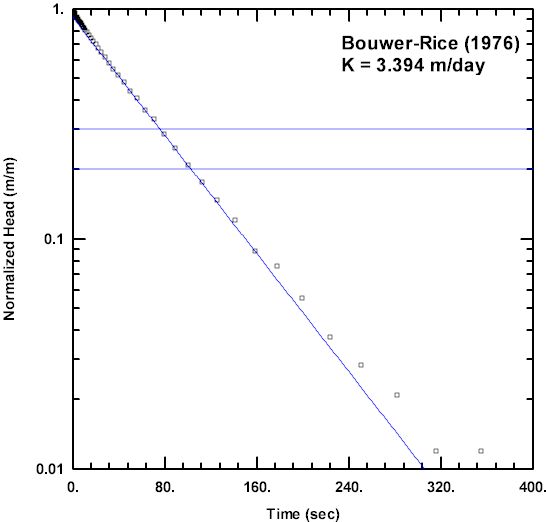
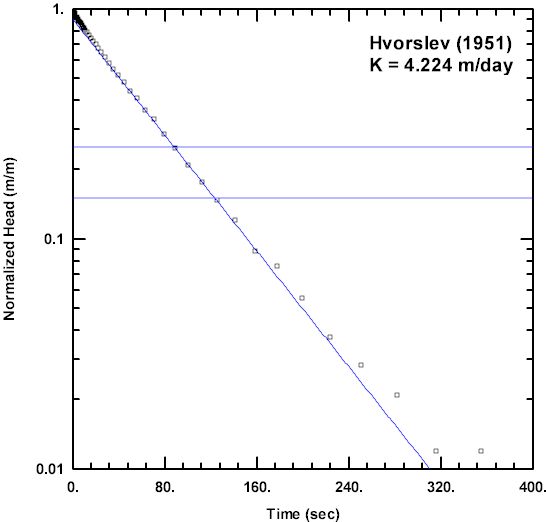
The following example from Butler (1998) compares the KGS Model (Hyder et al. 1994), Bouwer and Rice (1976) and Hvorslev (1951) methods for a slug test conducted in a partially penetrating well in an unconfined aquifer. The initial displacement in the well was 0.671 m and other parameters for the test are given in Table 1. The depth to the top of the well screen is 16.77 m below the water table and the aquifer thickness is 47.87 m. Analyses performed with AQTESOLV for the three methods are shown in Figures 2 through 4. For consistency and objectivity, the recommended normalized head ranges of Butler (1998) guided the fitting of the Bouwer and Rice and Hvorslev solutions. The KGS Model (Figure 2) rigorously accounts for elastic storage in the aquifer, while the Bouwer-Rice (Figure 3) and Hvorslev (Figure 4) methods both use the quasi-steady-state approximation of slug-induced flow (Butler 1998); however, despite different underlying assumptions, all three methods yield very similar estimates of K for this slug test. Interestingly, the Hvorslev solution, which is commonly associated with confined aquifers, produces an estimate of K that is closer to the value computed with the more rigorous KGS Model than the Bouwer-Rice solution which is typically associated with unconfined aquifers.
| Table 1. Well Construction Details for Well 4, Pratt County Monitoring Site 36 | ||||
| Well Radius, rw (m) |
Casing Radius, rc (m) |
Screen Length, L (m) |
Aquifer Thickness, b (m) |
Depth to Top of Screen, d (m) |
| 0.125 | 0.064 | 1.52 | 47.87 | 16.77 |
Normalized Head
Normalized head is defined as follows:
normalized head = H(t)/H0
where H(t) is the displacement measured at time t and H0 is the initial displacement at time t=0.
Dimensionless Storage Parameter (α)
Cooper et al. (1967) define a dimensionless storage parameter (α) as follows:
α = rw²S/rc²
where rw is well radius, S is aquifer storage coefficient and rc is casing radius.
Dimensionless Time (tD)
Dimensionless time (tD) is defined as follows:
tD = Tt/rc²
where T is transmissivity, t is time and rc is casing radius.
Gravel Pack Correction
For a partially submerged well screen, Bouwer (1989) recommends the following calculation to correct the casing radius for slug test analysis:
equivalent casing radius = [(1-n)rc² + nrw²]½
where n is effective porosity of the gravel/filter pack, rc is casing radius and rw is well radius.
Effective Screen Length (L)
In most settings, the effective length of the well screen used in equations for slug test analysis is the nominal length of the well screen. In low-permeability aquifers, Fetter (2001) advises using the length of the gravel/filter pack in the well annulus for the effective screen length; however, Butler (1998) recommends always using the nominal screen length for the analysis of slug test data. Butler reasons that well development (e.g., pumping, surging, etc.) has little effect on restoring the aquifer adjacent to the wellbore to its pre-drilling condition outside of the screened interval of the well. Consequently, sections of the gravel/filter pack above or below the well screen, where the aquifer adjacent to the wellbore remains undeveloped, can contribute little flow during a slug test.
Double Straight-Line Effect
Bouwer (1989) pointed out a double straight-line effect in certain slug test analyses when the screen of the test well straddles the water table (i.e., the well screen is partially submerged).
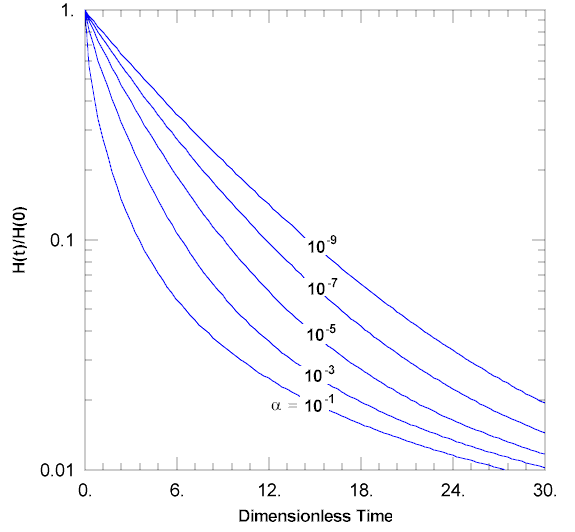
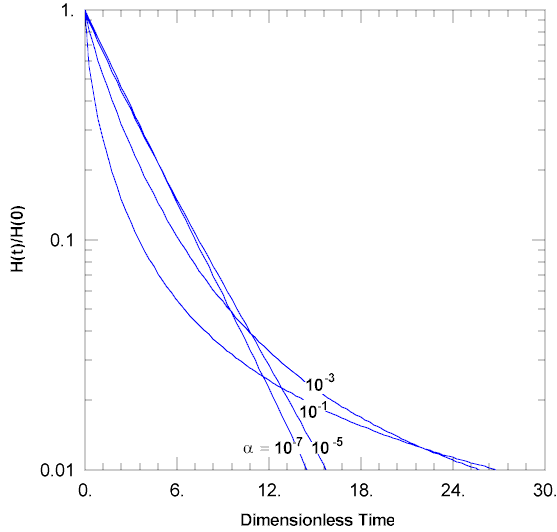
In other cases, data from a slug test may show a concave upward appearance that is similar to the double straight-line effect but unrelated to a partially submerged well screen. According to Butler (1998), the concave upward appearance of slug test data becomes more pronounced as the dimensionless storage parameter (α) increases.
Wells Screened Across Water Table
Slug tests performed in wells screened across the water table often result in data with a double straight line.
Bouwer (1989) interprets the first (earlier) straight segment of the data as drainage into the well from a permeable gravel pack. The second (later) straight portion of the data is considered more indicative of flow into the well from the aquifer.
According to Bouwer (1989), when the well screen is partially submerged and the double straight-line effect is present, the second straight portion of the data should be used to calculate the K of the aquifer with the Bouwer and Rice (1976) slug test solution. Butler (1998) confirms this approach and recommends matching the straight line to normalized head values ranging between 0.2 and 0.3 (see below).
If the well screen remains submerged throughout a slug test, flow into the well should be controlled by the aquifer alone, and the double straight-line effect should not be apparent (Bouwer 1989).
Recommended Normalized Head Ranges
To overcome ambiguity in matching straight-line solutions to slug test data exhibiting the double straight-line effect or a concave upward appearance, Butler (1998) recommends matching the Hvorslev (1951) and Bouwer and Rice (1976) straight-line solutions to a specific range of normalized head.
| Solution Method |
Recommended Normalized Head Range for Straight Line Match |
| Hvorslev (1951) | 0.15 to 0.25 |
| Bouwer and Rice (1976) | 0.20 to 0.30 |
See also: slug tests