Statistical Analysis
AQTESOLV Advantage
Only AQTESOLV provides a thorough statistical analysis of your curve fitting results.
"I really like the automatic gridding link to Surfer!"
--David Dahlstrom, Barr Engineering
When you perform automatic or visual curve matching, AQTESOLV provides a statistical analysis of the curve fitting results.
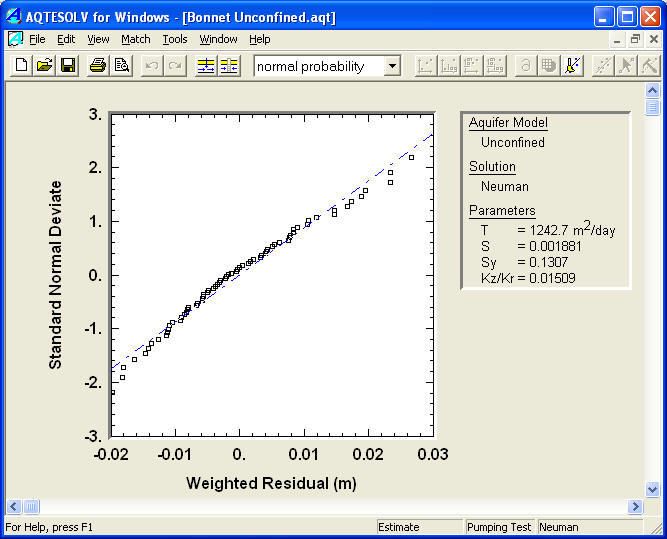
- Residual statistics and residual plots help you analyze the errors between the observed displacement data and an aquifer test solution.
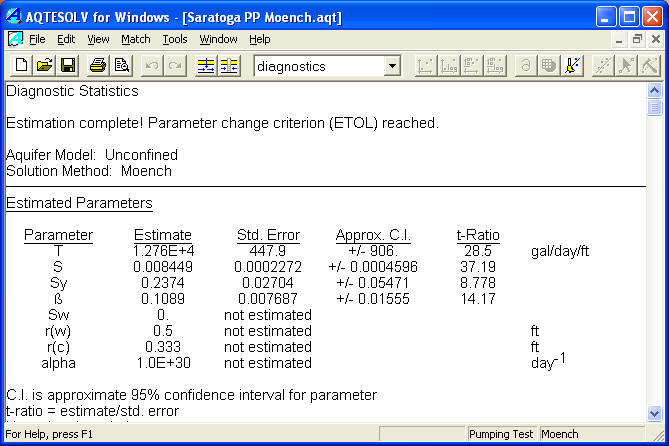
- Standard errors allow you to construct approximate confidence intervals for each hydraulic parameter (e.g., T or S) in an aquifer test solution (automatic curve matching only).
Residual Plots
Only AQTESOLV includes the following residual plots help to evaluate the fit of a model: residual vs. time, residual vs. simulated and normal probability plots.

Statistical Diagnostics Report
Only AQTESOLV supplies you with parameter statistics including confidence intervals.
