Analysis of a Constant-Rate Pumping Test in an Anisotropic Unconfined Aquifer
Lohman (1972) presented data from a constant-rate pumping test performed in an unconfined aquifer with delayed gravity response near Ione, Colorado. The thickness of the unconfined alluvium was 39.4 ft. The fully penetrating test well pumped at a rate of 1170 gallons-per-minute (gpm) for 4270 minutes.
The following drawdown data were recorded in an observation piezometer (Well B2-66-7dda2) located 63 ft from the test well at a depth of 19.7 ft below the static water surface (column 1 contains time in minutes and column 2 contains drawdown in ft):
1 0.28
2 0.38
3 0.38
4 0.44
5 0.48
6 0.50
7 0.52
8 0.53
9 0.56
10 0.56
12 0.61
14 0.65
16 0.67
18 0.70
20 0.72
24 0.79
28 0.82
36 0.92
40 0.96
50 1.00
60 1.15
70 1.24
80 1.30
90 1.38
100 1.42
120 1.55
140 1.67
160 1.74
180 1.84
200 1.93
240 2.05
280 2.17
320 2.27
360 2.36
400 2.48
460 2.55
520 2.66
580 2.74
700 2.91
820 3.02
940 3.17
1060 3.22
1300 3.41
1360 3.44
1420 3.48
1480 3.48
1540 3.51
1600 3.56
1660 3.57
1720 3.59
1810 3.64
1900 3.67
1960 3.70
2020 3.73
2380 3.84
2740 3.94
2800 3.96
2860 3.97
2920 3.98
2980 3.99
3040 4.00
3100 4.01
3160 4.02
3220 4.04
3280 4.03
3340 4.05
3400 4.05
3460 4.07
3820 4.14
4180 4.20
4240 4.21
4270 4.20
You can copy and paste these data into AQTESOLV.
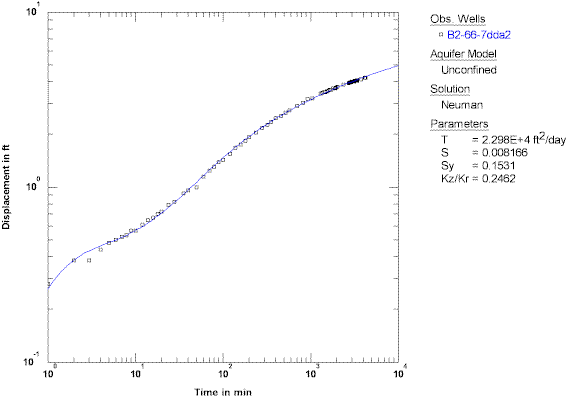
Enter the test data into AQTESOLV using the Pumping Test Wizard. Select the Neuman (1974) solution for an unconfined aquifer to analyze the data. Use automatic curve matching to obtain the curve fit shown below:

Hydraulic properties computed by AQTESOLV for this example compare favorably with values reported by Lohman (1972) who matched only late-time data using a solution by Dagan (1967).
| Hydraulic Parameter | Lohman (1972) | AQTESOLV |
| T (ft²/day) | 22,000 | 22,980 |
| Sy (dimensionless) | 0.2 (rounded) | 0.15 |
| Kz/Kr (dimensionless) | 0.3 | 0.25 |
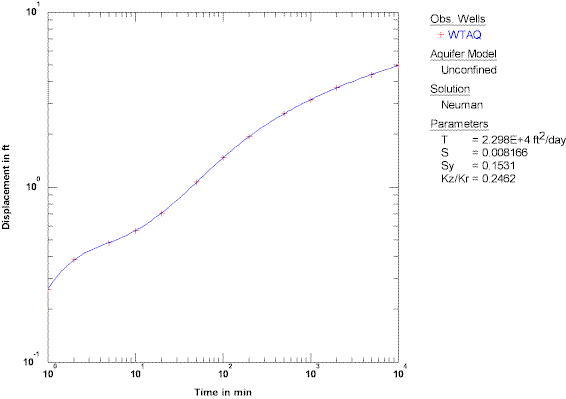
We can benchmark the calculations of AQTESOLV against WTAQ, a public-domain computer program developed by Barlow and Moench (1999) of the USGS. The following plot illustrates the excellent agreement between AQTESOLV (shown by the blue curve) and WTAQ (indicated by red crosses) for this application of the Neuman (1974) solution:
