Transforming Data From Data Loggers (Slug Test)
You've performed a rising-head slug test and imported the data logger file containing the water-level data into AQTESOLV. You expect to see displacements (change in water level from static) exhibiting a maximum at the start of the test (t=0) and recovering toward zero (the static condition) by the end of the test, but when you plot the data that you've entered, the graph is similar to the one below (on linear axes):
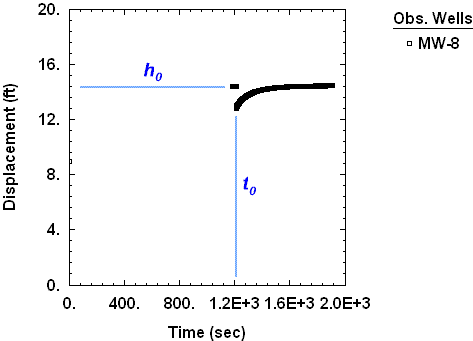
In this particular example, you have imported readings for the depth of the transducer during the test rather than displacement data. The imported measurements also record time since starting the data logger instead of time since initiating the test.
You need to transform your data into readings of elapsed time since the start of the test and displacement. You can use AQTESOLV to make the necessary transformations that shift the time and water-level data. To perform adjustments, you will need the following two bits of information:
- the pre-test water-level reading recorded by the data logger, h0
- the time recorded by the data logger when the test began, t0
Note that you can perform the requisite transformations when importing data logger files using the Import Wizard or by using the procedure described below to transform data that you've already imported.
Determine Pre-Test Depth of Transducer
In this example, the first few readings which plot at the same water-level value at the start of the data record are pre-test (static) water-level measurements recorded before the initiation of the test.
Choose Edit>Wells>Modify and click the Observations tab to view the spreadsheet containing the readings from the test. Inspect the initial water-level readings to determine the stabilized pre-test depth of transducer reading, h0. In this example, the pre-test readings indicate h0 = 14.36 ft.
Convert Depth Readings to Displacement
Subtract h0 from all of the measurements in the observations spreadsheet to convert depth of transducer readings to displacement (change in water level from static).
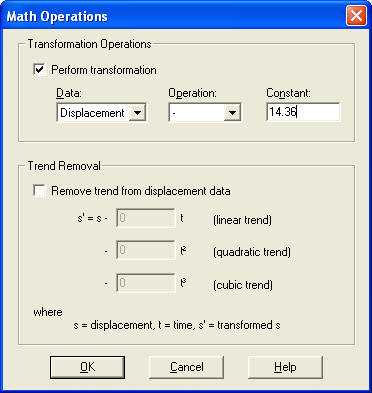
Click Select All next to the spreadsheet. Click Math and check the box to perform the transformation. Select displacement for data, choose subtraction for operation, and enter 14.36 for the constant (the constant for your test will be different). Click OK. Click Yes to confirm that you want to perform the transformation.
Identify When Test Began
Scroll down in the spreadsheet and look for the maximum displacement value indicating the start of the test. For this rising-head slug test, the largest displacement (-1.5653 ft) occurs at t0 = 1214 seconds.
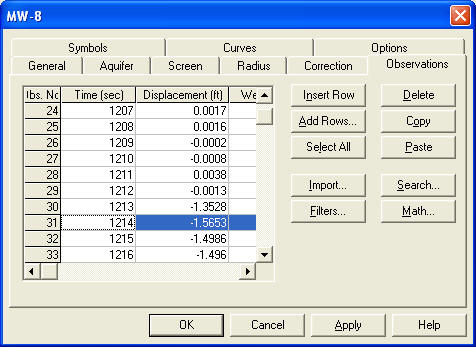
Note that displacements are negative in this example because the water column above the transducer dropped in response to your removing the slug from the well.
Adjust Starting Time of Test
Subtract t0 from all of the time measurements in the observations spreadsheet to align the start of the test (t=0) with the maximum displacement.
Click Select All. Click Math and check the box to perform the transformation. Select time for data, choose subtraction for operation, and enter 1214 for the constant (the constant for your test will be different). Click OK and click Yes to proceed with the transformation.
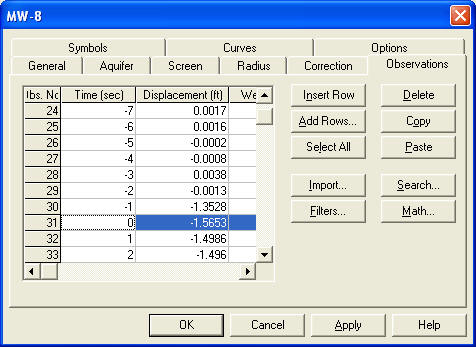
After the transformation, the initiation of the test (t=0) corresponds to the reading with the maximum displacement.
Check Initial Displacement
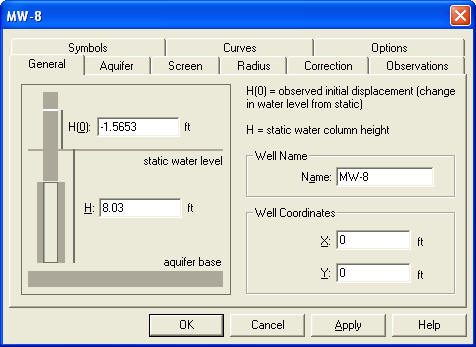
After transforming the data, click the General tab and check the initial displacement, H(0), that you entered for the test. It should have the same sign (negative in this example) as the displacement values in the observations spreadsheet.
Transformed Data
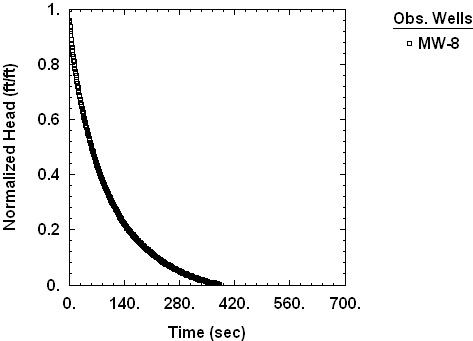
After performing the foregoing transformations, the displacement data plotted as normalized head on linear axes show the expected declining trend with time since the start of the test.
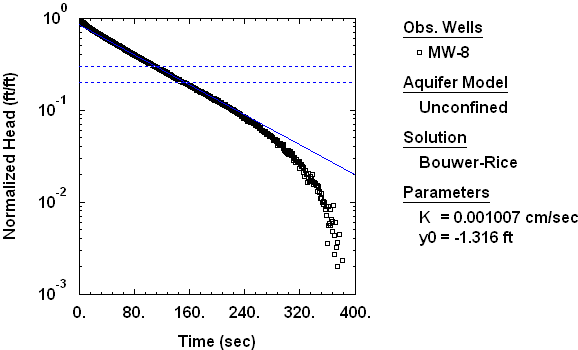
Analysis of the transformed slug test data with the Bouwer and Rice (1976) solution for an unconfined aquifer yields the result shown below.
Transforming Data With Import Wizard
You can perform the same transformations described above when importing data logger files with the Import Wizard.
Enter the constants t0 and h0 in Step 3 of the Import Wizard to shift the time and displacement data as they imported from the data logger file as shown below.
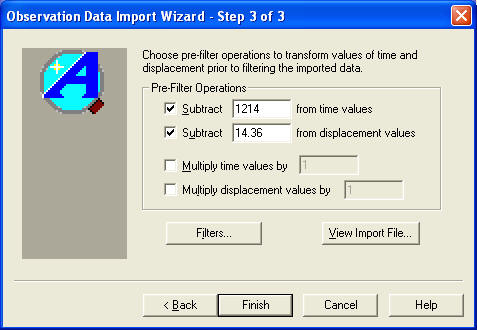
Note that you can click the View Import File button in the Import Wizard to inspect the contents of the data logger file and determine the constants t0 and h0.