Bouwer and Rice Slug Test Solution for Unconfined Aquifers
Related Solution Methods
Additional Topics
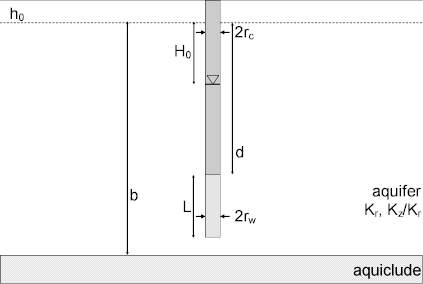
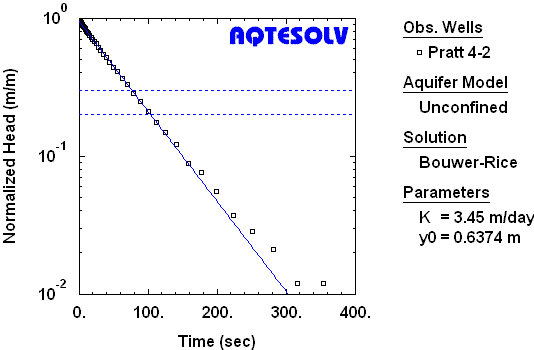
 A mathematical solution by Bouwer and Rice (1976) is useful for determining hydraulic conductivity () of an unconfined aquifer from an overdamped slug test. Analysis involves matching a straight line to water-level displacement data collected over time.
Herman Bouwer (1927-2013) and Bob Rice used a resistance-network analog to develop an empirical model for rate of water-level recovery during a slug test in an unconfined aquifer. Their solution places a constant-head boundary at the water table and the control well may be fully or partially penetrating. Like the Hvorslev method, the Bouwer and Rice model assumes quasi-steady state flow by neglecting aquifer storativity. Subsequent modifications to the solution account for filter pack drainage (Bouwer 1989) and hydraulic conductivity anisotropy (Zlotnik 1994).
In cases of noninstantaneous test initiation, apply the translation method of Pandit and Miner (1986) prior to analyzing the data.
If the test well is screened across the water table, you may apply an optional correction for the effective porosity of the filter pack. When the test well is fully submerged (i.e., screened below the water table) or the aquifer is confined, the correction is unnecessary.
Assumptions
- aquifer has infinite areal extent
- aquifer is homogeneous and of uniform thickness
- aquifer potentiometric surface is initially horizontal
- control well is fully or partially penetrating
- a volume of water, V, is injected or discharged instantaneously from the control well
- aquifer is confined or unconfined
- flow is steady
Equations
Bouwer and Rice (1976) developed an empirical relationship describing the water-level response in an unconfined aquifer due to the instantaneous injection or withdrawal of water from a well:
where
- is displacement at time [L]
- is initial displacement at [L]
- is radial (horizontal) hydraulic conductivity [L/T]
- is vertical hydraulic conductivity [L/T]
- is screen length [L]
- is effective porosity (specific yield) of the filter pack [dimensionless]
- is nominal casing radius [L]
- is well radius [L]
- is external or effective radius of the test [L]
- is elapsed time since initiation of the test [T]
Notes
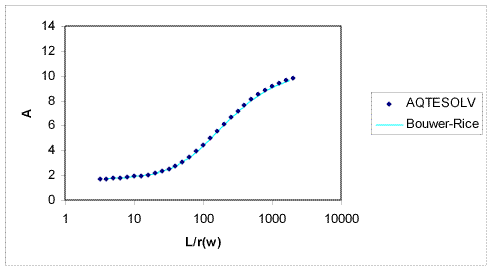
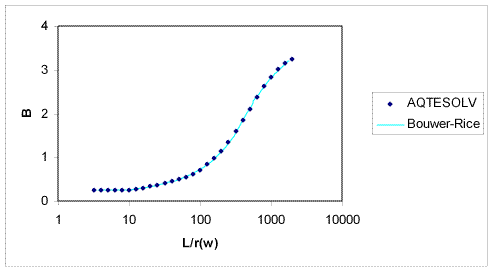
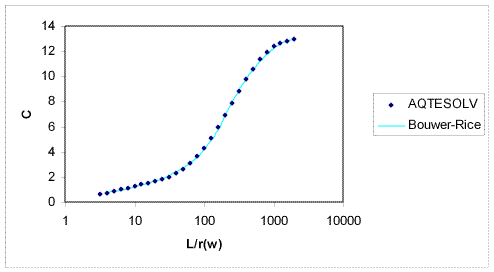
- The term in Equation 1 is an empirical quantity determined from the analog model that accounts for well-aquifer geometry.
- Note that is typically taken as the borehole radius (i.e., extending to the outer radius of the filter pack) when the filter pack is expected to be more conductive than the aquifer.
- AQTESOLV allows you to use the effective casing radius in Equation 2 when response data from a well screened across the water table exhibit a double-straight line appearance due to filter pack drainage. No correction to the casing radius is necessary when the screen is fully submerged below the water table or the aquifer is confined.
- AQTESOLV includes recommended head ranges (Butler 1998) for the Bouwer and Rice solution that can reduce ambiguity when interpreting response data with a concave upward appearance.
- Although developed originally for unconfined aquifers, Bouwer (1989) noted the utility of the Bouwer and Rice method for slug tests in confined aquifers as well.
Data Requirements
- test well measurements (time and displacement)
- initial displacement
- casing radius and well radius
- depth to top of well screen and screen length
- saturated thickness
- porosity of gravel pack for well screened across water table (optional)
- hydraulic conductivity anisotropy ratio (for partially penetrating wells)
Solution Options
- partially penetrating wells
- correction for gravel pack porosity
- hydraulic conductivity anisotropy
Estimated Parameters
- (hydraulic conductivity)
- (intercept of line on y axis)
Curve Matching Tips
- Follow guidelines developed by Butler (1998) for analyzing slug tests.
- Choose Match>Visual to perform visual curve matching using the procedure for straight-line solutions.
- For this solution, visual curve matching is often more effective than automatic matching because you are interested in matching the straight line to a specific range of data that meet the assumptions of the solution. To achieve the same effect with automatic curve matching, it would require the judicious application of weights to ignore observations outside the desired range.
- Choose View>Options and select the Recommended Head Range option in the Plots tab to superimpose on the plot the head range recommended by Butler (1998) to obtain the most reliable matching results for solutions (assuming a steady-state representation of flow for a slug test).
Benchmarks
References
Bouwer, H., 1989. The Bouwer and Rice slug test--an update, Ground Water, vol. 27, no. 3, pp. 304-309.
Bouwer, H. and R.C. Rice, 1976. A slug test method for determining hydraulic conductivity of unconfined aquifers with completely or partially penetrating wells, Water Resources Research, vol. 12, no. 3, pp. 423-428.
Zlotnik, V., 1994. Interpretation of slug and packer tests in anisotropic aquifers, Ground Water, vol. 32, no. 5, pp. 761-766.