Tutorial for Slug Test in Unconfined Aquifer
Conceptual Model (Description of Test)
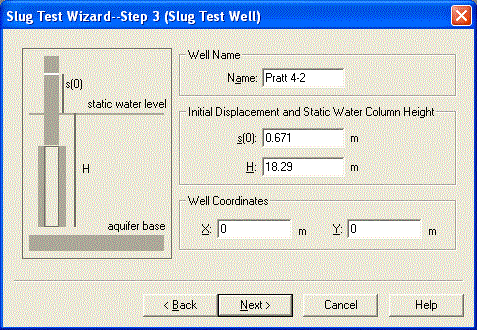
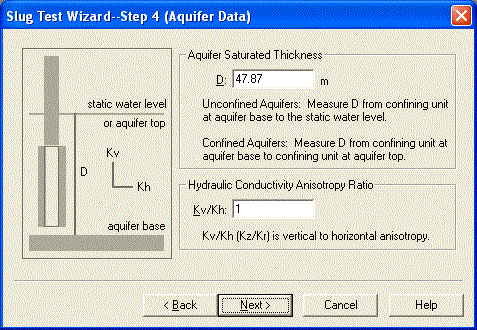
Butler (1998) presents results from a slug test in a partially penetrating well that is screened in unconsolidated alluvial deposits consisting chiefly of sand and gravel with interbedded clay. Table 1 summarizes well construction details.
| Table 1. Well Construction Details for Well 4, Pratt County Monitoring Site 36 | ||||
| Well Radius, rw (m) |
Casing Radius, rc (m) |
Screen Length, L (m) |
Aquifer Thickness, b (m) |
Depth to Top of Screen, d (m) |
| 0.125 | 0.064 | 1.52 | 47.87 | 16.77 |
The initial displacement in the well (H0) was 0.671 m.
Data Entry
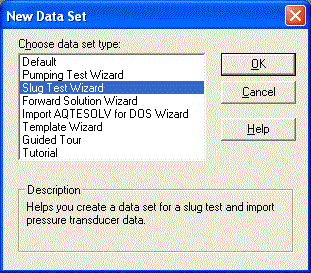
Start the AQTESOLV application (v. 3.0 or higher) and choose File | New to create a new data set that will contain data from the slug test. Select Slug Test Wizard to enter data from the slug test. Click OK.
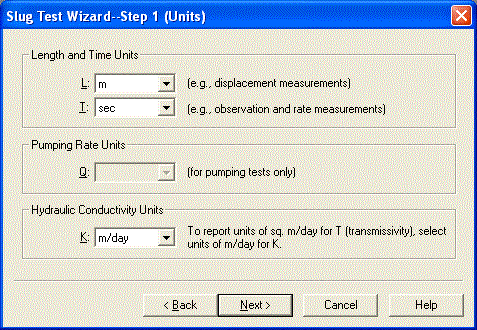
Follow the steps in the wizard to enter data from the slug test. For the units of measurement, choose m (meters) for length, sec (seconds) for time and m/day for hydraulic conductivity.
Click Next to skip the annotations step of the wizard and continue entering data as shown below.
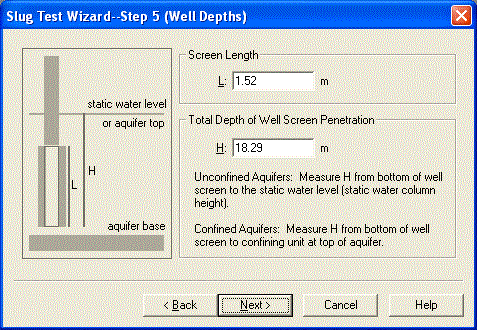
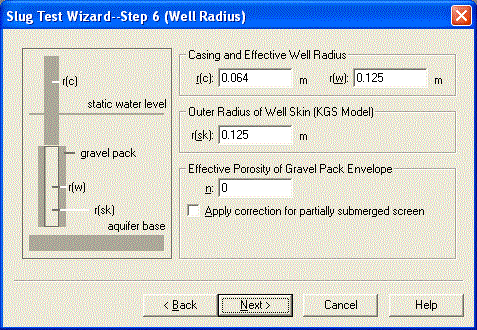
In the last step of the wizard, enter the following time and displacement measurements into the spreadsheet for observation data. You can copy the data shown below and paste it into AQTESOLV using the Windows clipboard.
0.1 0.663
0.2 0.664
0.3 0.656
0.4 0.656
0.5 0.656
0.6 0.656
0.7 0.653
0.8 0.649
0.9 0.649
1.1 0.649
1.2 0.645
1.3 0.642
1.5 0.653
1.6 0.648
1.8 0.642
2 0.638
2.3 0.63
2.6 0.627
2.9 0.619
3.2 0.619
3.6 0.616
4 0.608
4.5 0.605
5.1 0.596
5.7 0.59
6.4 0.587
7.1 0.579
8 0.568
9 0.56
10 0.553
11.3 0.539
12.6 0.531
14.2 0.517
15.9 0.501
17.8 0.486
20 0.469
22.4 0.45
25.2 0.435
28.2 0.413
31.7 0.39
35.5 0.368
39.9 0.346
44.7 0.321
50.2 0.295
56.3 0.273
63.1 0.244
70.8 0.221
79.5 0.191
89.2 0.166
100.1 0.14
112.3 0.118
125.9 0.099
141.3 0.081
158.5 0.059
177.9 0.051
199.6 0.037
223.9 0.025
251.2 0.019
281.9 0.014
316.3 0.008
354.9 0.008
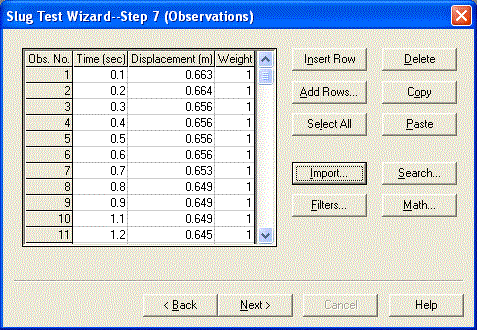
As an alternative to the cut-and-paste option, click Import to use the Import Wizard for entering readings from the file named pratt4-2.dat. This text file consists of two columns of data with time (in seconds) in the first column and displacement (in meters) in the second column. Download the file to your computer before importing it.
Click Next when you have finished entering the data.
The Error Log should show no errors detected in the data set. Choose options from the Edit menu to correct any errors reported in the Error Log.
Model Estimation
Choose Match | Solution to select the Bouwer and Rice (1976) method for an unconfined aquifer from the list of available slug test solutions. Click OK.
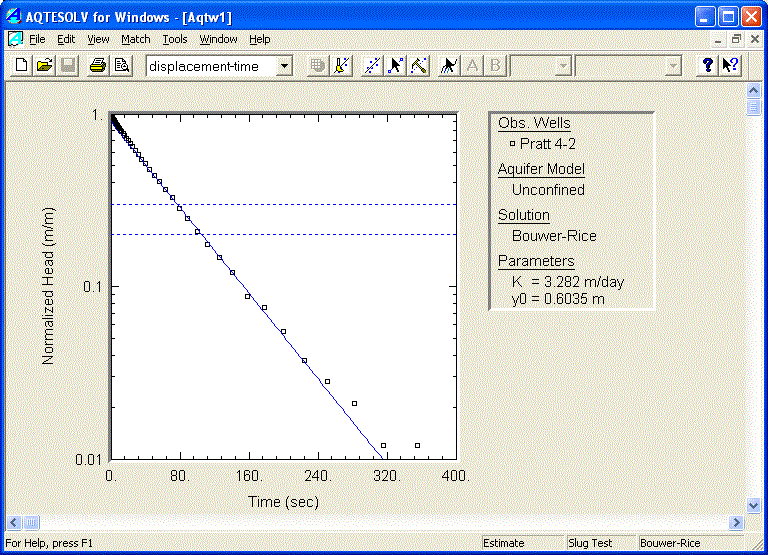
Choose View | Displacement-Time to display a plot of the data. Choose View | Options and the check Normalized head to display the data as relative displacement (H/H0) where H0 is the initial displacement at the start of the test. Also check Recommended head range to display the range of normalized head recommended by Butler (1998) for visual curve matching with the Bouwer-Rice solution. Click OK.
Choose Match | Visual to match the Bouwer-Rice solution to the displacement data.
- To reposition the curve, move the cursor to a point over the plot.
- Click and hold the left mouse button down. While continuing to hold the button down, move the mouse to draw a new line over the data.
- Release the mouse button to refresh the solution and update the aquifer properties shown in the legend to the right of the plot.
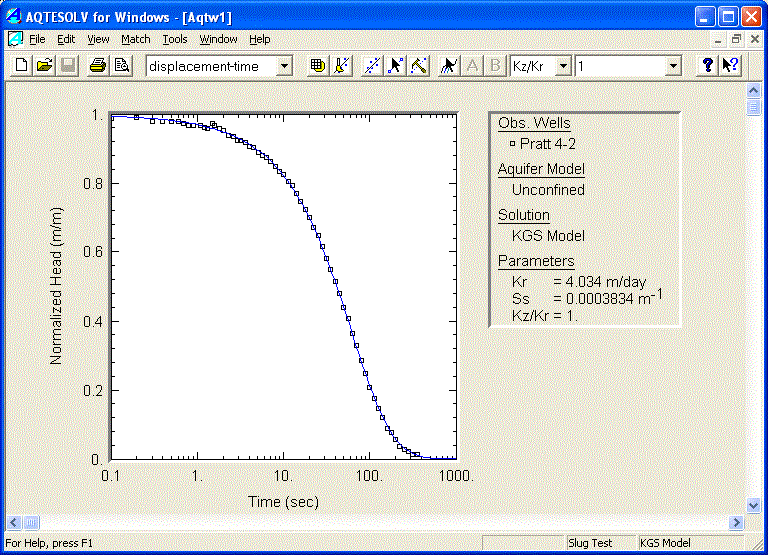
Next, choose Match | Solution to select the KGS Model (Hyder et al. 1994) for an unconfined aquifer from the list of available slug test solutions. Click OK.
Choose Match | Automatic to match the KGS Model solution to the test data.
- Click Estimate to start the automatic estimation procedure.
- During automatic estimation, AQTESOLV displays a window showing the progress of the iterative procedure. When the maximum number of iterations or convergence has been reached, click OK to continue.
- Click OK to close the Automatic Estimation windows and retain the estimated aquifer properties.
- TIPS
- Use the Automatic Matching button on the toolbar to initiate automatic curve matching. Choose Match | Automatic and click the Parameters tab to make parameters active or inactive during automatic estimation.
References
Bouwer, H. and R.C. Rice, 1976. A slug test method for determining hydraulic conductivity of unconfined aquifers with completely or partially penetrating wells, Water Resources Research, vol. 12, no. 3, pp. 423-428.
Butler, J.J., Jr., 1998. The Design, Performance, and Analysis of Slug Tests, Lewis Publishers, New York, 252p.
Hyder, Z., J.J. Butler, Jr., C.D. McElwee and W. Liu, 1994. Slug tests in partially penetrating wells, Water Resources Research, vol. 30, no. 11, pp. 2945-2957.