Derivative Analysis
by Glenn M. Duffield, President, HydroSOLVE, Inc.
Derivative analysis is a powerful diagnostic method for the evaluation of pumping tests. The technique was introduced in the petroleum industry literature (Bourdet et al. 1983; Bourdet et al. 1989) and has been used by groundwater hydrologists for a number of years (Spane and Wurstner 1993).
The so-called Bourdet derivative uses the following simple three-point formula to compute derivatives from drawdown data by numerical differentiation:

where T is an appropriate time function (e.g., elapsed time or Agarwal equivalent time). Essentially, this formula is a weighted average of slopes computed from data points on either side of data point i. In the above formula, the two slopes are

and

These slopes are also known as the left and right derivative, respectively.
An important aspect of performing derivative analysis is the selection of an appropriate calculation method. Bourdet (2002) recommends using adjacent points (nearest neighbors) for preliminary derivative analysis; however, this method often results in noisy derivatives. To remove noise from the calculations, the Bourdet method uses data points separated by a fixed distance measured in logarithmic time. Typically, the separation or differentiation interval required to remove noise ranges between 0.1 and 0.5 of a log cycle. In selecting the differentiation interval, care must be exercised to avoid overly smoothing the data.
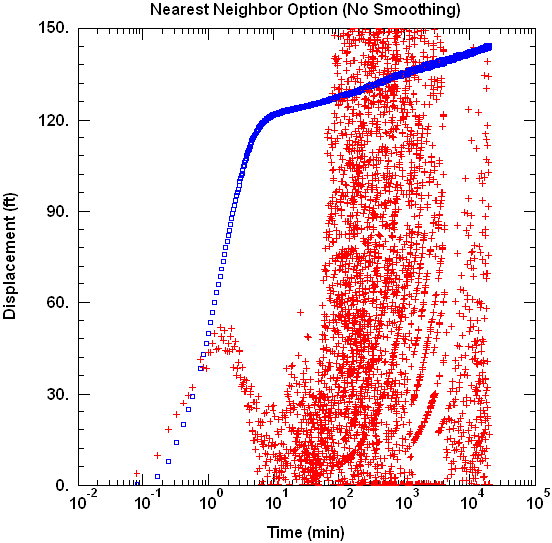
Consider the following semilog plot of drawdown (blue symbols) and derivatives (red symbols). The data are from a single-well pumping test conducted in a confined aquifer (i.e., drawdown data measured in the pumped well). As you can readily observe in the figure below, the derivatives computed with the nearest neighbor method are very noisy.

Note that the noise in the above plot becomes very pronounced after about 100 minutes during the period when the drawdown shows a near constant slope (the period known to petroleum reservoir engineers as infinite-acting radial flow) where we would typically match the Cooper-Jacob (1946) straight-line solution. During this period, the derivative should be constant; however, any small measurement errors or rate fluctuations are well known to introduce noise into the calculated derivatives.
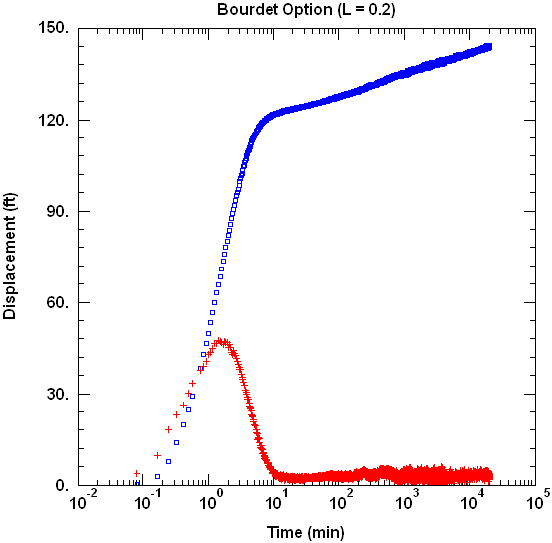
We may use the Bourdet method to smooth the derivatives with a differentiation interval of 0.2 to reduce the noise as shown on the following semilog plot.

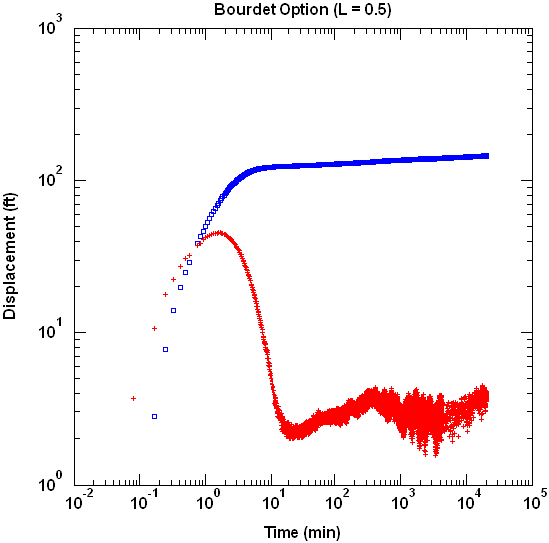
The standard derivative plot combines drawdown and derivative data on log-log axes. For this example, we increased the differentiation interval to 0.5 on the log-log plot (below).

The peak or hump observed in the derivative data at early time (above) is diagnostic of wellbore storage. In a confined aquifer, we expect stabilization of the derivative approximately 1.5 log cycles after the peak. At later time, the derivative is observed to nearly stabilize which is indicative of radial flow in an infinite-acting aquifer (i.e., Theis conditions). The broad fluctuations in the derivative signal are attributed to pumping rate variations during the two-week test.
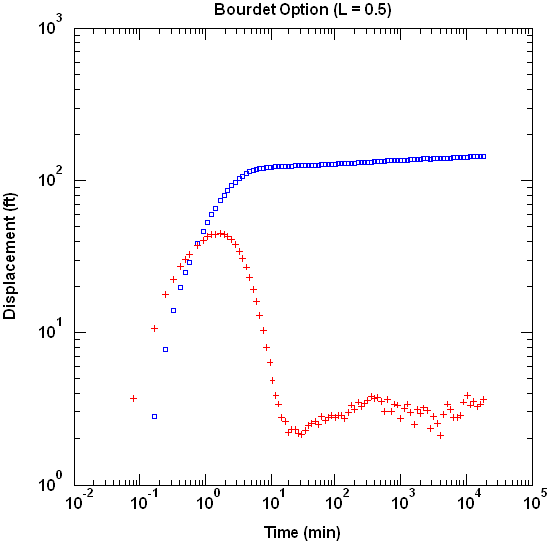
If we reduce the data set by sampling measurements at a rate of 20 per log cycle time, we obtain essentially the same derivative plot as the complete data set.

Spane and Wurstner (1993) presented an alternative method for computing derivatives. Like the Bourdet method, the Spane method uses a logarithmic differentiation interval; however, instead of using three points in the derivative computation, the Spane method computes the left and right derivatives by applying linear regression to all of the points falling within the differentiation interval. In many cases, one finds that the Spane method produces a smoother derivative than the Bourdet method.
See also: derivative analysis