Recovery Tests
by Glenn M. Duffield, President, HydroSOLVE, Inc.
Confined Aquifers
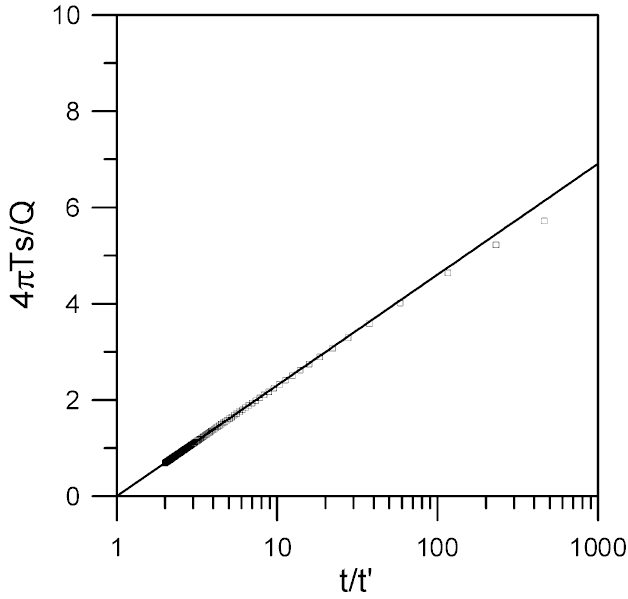
Theis (1935) devised a method of analyzing data from a recovery test in a confined aquifer in which residual drawdown, s', is plotted as a function of t/t', where t is the time since pumping began and t' is the time since pumping stopped. In a confined aquifer, the data from a recovery test are expected to fall on a straight line on a plot of s' vs t/t'.
Double-Porosity Aquifers
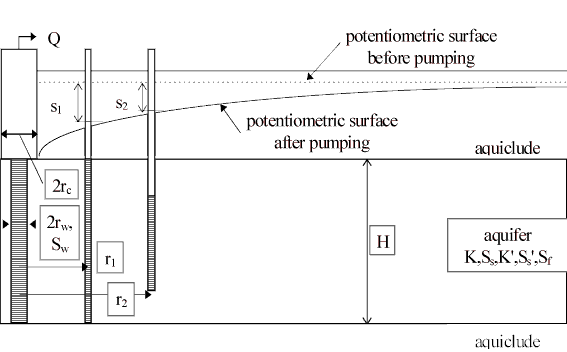
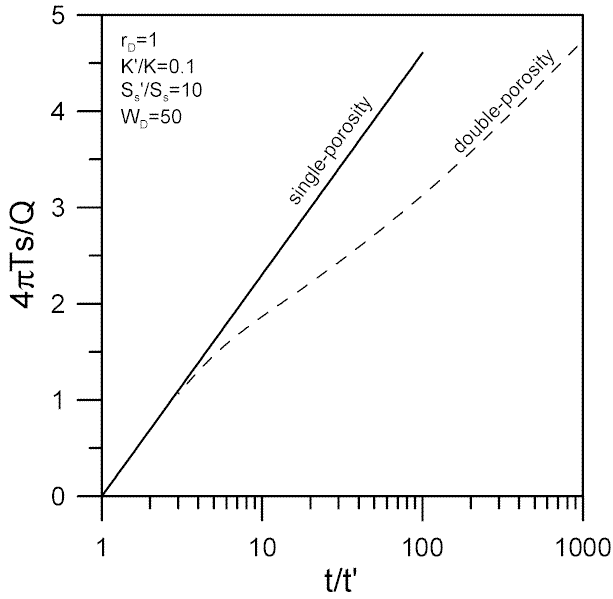
Fractured media are sometimes represented by double-porosity models in which the fractures and matrix are treated as overlapping media. Dougherty and Babu (1984) and Moench (1984) proposed models for the analysis of pumping tests in double-porosity systems (Figure 2). Figure 3 compares the response for recovery tests in single- and double-porosity media.
See also: recovery tests