Recovery Tests
by Glenn M. Duffield, President, HydroSOLVE, Inc.
What Is A
Recovery Test?
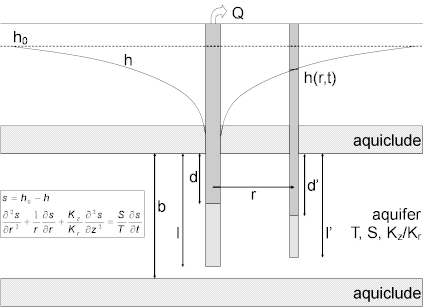
A recovery test is a controlled field experiment performed at the end of a pumping test (constant-rate or step-drawdown) after pumping in the pumped (control) well has ended. Water-level response (residual drawdown) is measured after pumping has stopped in one or more surrounding observation wells and optionally in the control well itself.
In petroleum engineering, a buildup test refers to a recovery test after a production well is shut in (i.e., after pumping stops). Similarly, a falloff test is a recovery test performed after injection in a well ceases.
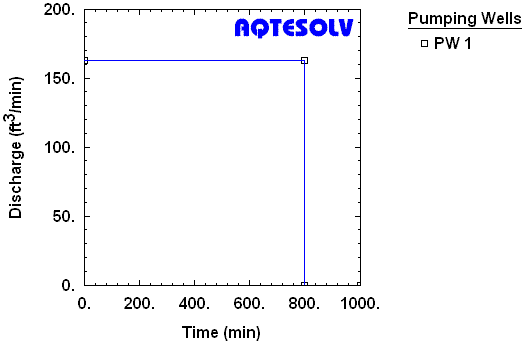
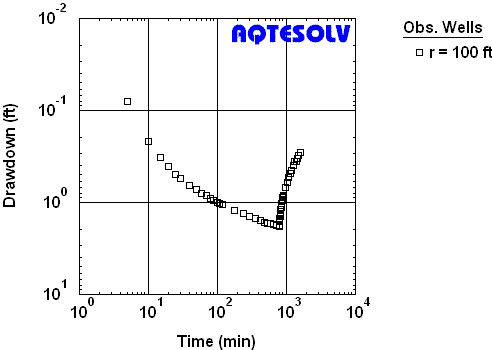
Figure 2 illustrates pumping rates recorded during and after a constant-rate pumping test in a confined aquifer (USBR 1995). A plot of drawdown and recovery recorded during the test is shown in Figure 3.
Estimation Of
Aquifer Properties
The goal of a recovery test, as in any aquifer test, is to estimate hydraulic properties of an aquifer system such as transmissivity, hydraulic conductivity and storativity (storage coefficient). One typically measures recovery after the termination of a constant-rate or step-drawdown pumping test to provide additional data for estimating aquifer properties.
Typically, aquifer properties are estimated from a recovery test by fitting mathematical models (type curves) to residual drawdown data through a procedure known as curve matching.
Three methods available for estimating aquifer properties from recovery test data include the following:
- residual drawdown analysis (s' versus log t/t')
- Agarwal method (recovery versus Agarwal equivalent time)
- combined analysis of drawdown and recovery data (s versus t)
One may use each of the three methods of recovery analysis to interpret tests performed in nonleaky confined, leaky confined, unconfined and fractured aquifers.
Residual Drawdown Analysis
Theis (1935) was the first to devise a method for estimating aquifer properties from recovery data. The procedure involves fitting a straight line on a residual drawdown plot of s' (residual drawdown) versus log t/t' (ratio of time since pumping began to time since pumping stopped). In the petroleum engineering literature, a residual drawdown plot is known as a Horner plot (Horner 1951).
Figure 4 shows how to apply the Theis (1935) solution to residual drawdown data from the USBR (1995) recovery test (Figure 3). Note that the fitted line favors data from the end of the recovery period which plot closer to the origin of the graph (i.e., as t/t' approaches 1). The method estimates the transmissivity (T) of the aquifer and S/S', the ratio of storativity during pumping (S) to storativity during recovery (S'). For an infinite nonleaky confined aquifer, S/S' should be close to 1.
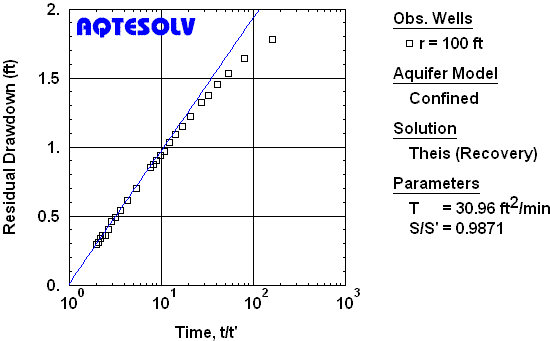
Residual drawdown plots are applicable to recovery data from variable-rate as well as constant-rate pumping tests (Horner 1951; Birsoy and Summers 1980). Furthermore, one may use solutions other than the Theis 1935 method to analyze recovery tests on a s' versus t/t' plot.
Agarwal Method
Through a simple data transformation, Agarwal (1980) devised a procedure for the interpretation of recovery data that allows the application of standard curve-matching techniques, including diagnostic techniques like derivative analysis, routinely used for drawdown data. The Agarwal method is widely used by petroleum engineers (Horne 1995) and is steadily gaining recognition among groundwater scientists.
The Agarwal method involves the following simple data transformations for recovery test data (assuming constant-rate pumping):
where is recovery measured from [L], is total drawdown at the end of pumping [L], is residual drawdown during recovery [L], is Agarwal equivalent time [T], is total time of pumping [T], and is time since pumping stopped [T]. The method assumes that > . For multi-rate tests, Agarwal (1980) proposed a different formula for that is slightly more complicated than the one given above.
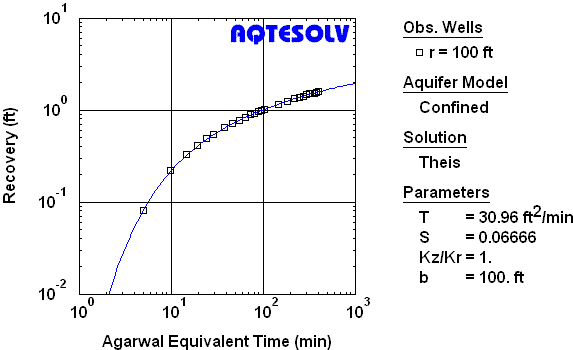
Figure 5 shows results from the analysis of the USBR (1995) recovery data using the Agarwal method. After the Agarwal transformation, the familiar Theis (1935) type curve was matched to the recovery data to estimate transmissivity and storativity for the aquifer.
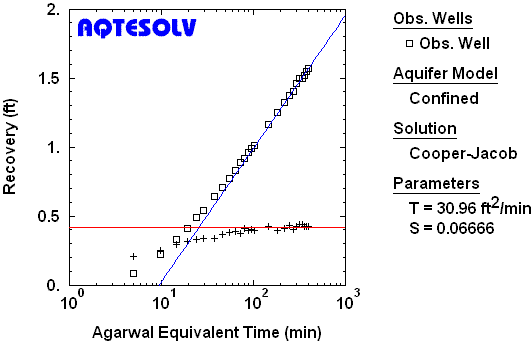
One may use other methods such as the Cooper and Jacob (1946) straight-line solution in conjunction with the Agarwal method of recovery analysis (Figure 6). The same derivative plateau used to identify infinite-acting radial flow in drawdown data is also evident on an Agarwal plot and guides the match of the Cooper-Jacob straight line (Figure 6).
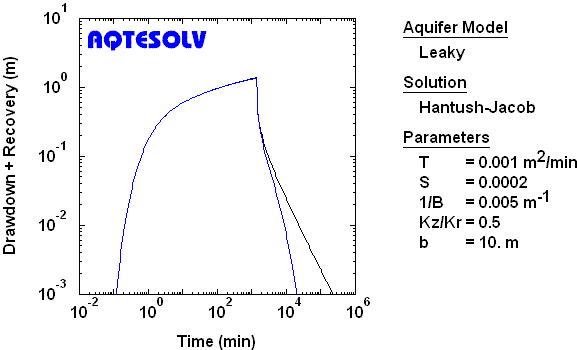
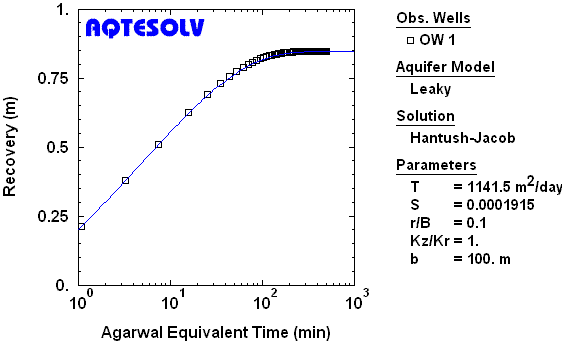
Use of the Agarwal recovery method is not restricted to nonleaky confined aquifers. As a demonstration, consider the synthetic drawdown and recovery data from a constant-rate test in a leaky confined aquifer shown in Figure 7.
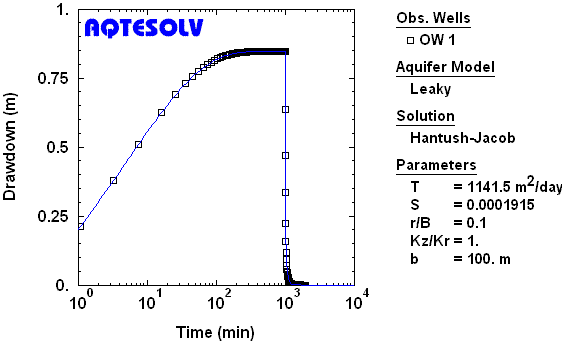
If we analyze only the recovery data from the synthetic test (Figure 6), the Agarwal method allows us to match a Hantush and Jacob (1955) drawdown curve to the transformed data very accurately (Figure 8).
Combined Drawdown/Recovery Analysis
The residual drawdown and Agarwal methods only make use of data from the recovery period of a pumping test. You can combine the analysis of drawdown and recovery data using virtually any pumping test solution through the application of superposition in time.
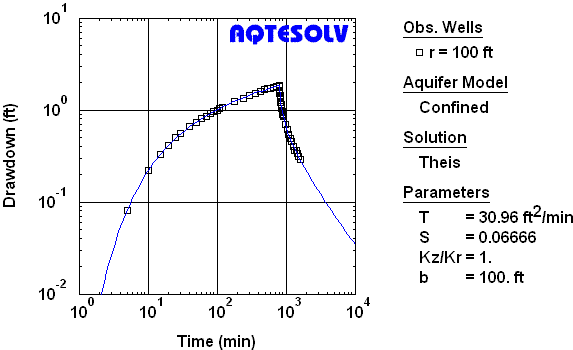
Figure 9 shows results of analyzing combined drawdown and recovery data with the Theis (1935) solution.
Catalog Of
Recovery Plots
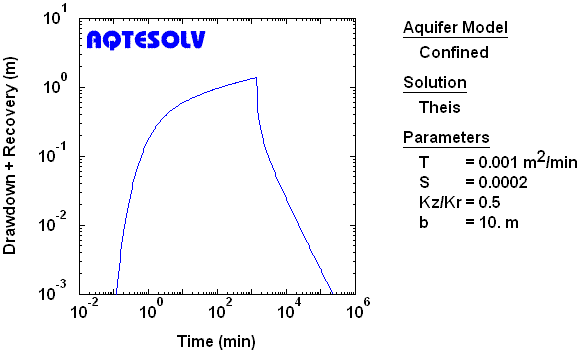
On the recovery plots presented below, drawdown responses are displayed as solid blue curves. For reference, the Theis solution is shown on selected plots by a dashed black curve. The following table provides well and aquifer parameters assumed for the plots (unless otherwise noted):
| Pumping (Control) Well | |
| constant discharge rate = | 0.002 m3/min |
| duration of pumping = | 1440 min |
| casing radius = | 0.1 m |
| well radius = | 0.1 m |
| depth to top of screen = | 5 m |
| screen length = | 5 m |
| Piezometer | |
| radial distance = | 3.16 m |
| depth = | 0.75 m |
| Aquifer | |
| thickness = | 10 m |
| vertical-to-horizontal anisotropy = | 0.5 |
Nonleaky Confined Aquifer
Observation Well, Line Source
Leaky Confined Aquifer
Partial Penetration, Incompressible Aquitard, Case 1
