Tutorial for Rising-Head Slug Test in Confined Aquifer
Perform the following tutorial to learn how to use AQTESOLV for the interpretation of a rising-head slug test in a confined aquifer.
- prepare a conceptual model
- inspect field data
- enter data into AQTESOLV
- perform diagnostics
- match solutions and estimate hydraulic conductivity
Follow the general steps in this example to analyze data from both rising- and falling-head slug tests.
Many thanks to Michelle Bouwman of JM Sorge Environmental Consultants for providing the test data used in this example!
Conceptual Model Preparation
A rising-head slug test was performed in 2013 in well MW-1D located in Union County, New Jersey, USA. The control well, installed in a six-inch diameter borehole drilled by mud rotary in 2004, has casing and screen made of two-inch diameter Schedule 40 PVC and is open to a confined formation composed of unconsolidated Pleistocene glacial deposits that overlie Triassic shale bedrock. A monitoring well record filed with the New Jersey Department of Environmental Protection contains a geologic log and construction details for the well.
| Table 1. Geologic Log for Well MW-1D | |
| Depth Below Land Surface (ft) | Description |
| 0 to 1 | topsoil |
| 1 to 20 | sandy silt with cobble |
| 20 to 50 | layers of sandy clay, silt and large cobble |
| 50 to 69 | small gravel, large gravel and fractured rock |
| 69 | bedrock |
Well MW-1D is screened from 59 to 69 ft below land surface in the coarse glacial deposits overyling bedrock. The well has a filter pack consisting of #2 gravel that extends from 57 to 69 ft below land surface.
| Table 2. Well Construction Details for Well MW-1D | |
| Borehole radius | 0.25 ft |
| Casing radius, rc | 0.083 ft |
| Well radius, rw | 0.083 ft |
| Depth to top of aquifer | 50 ft |
| Depth from top of aquifer to top of screen, d | 9 ft |
| Screen length, L | 10 ft |
| Aquifer thickness, b | 19 ft |
| Static depth to water | ~28 ft |
The approximate static water column height in the control well is the difference between the total well depth and the static depth to water, i.e., 69 ft - 28 ft = 41 ft.
The test was initiated with a solid slug that measured 1.5 inches in diameter and 31 inches in length.

The following formula computes the expected initial displacement in the control well:
where is expected initial displacement [L], is length of slug [L], is radius of slug [L] and is radius of well casing [L]. For this test, is 1.45 ft.
During the rising-head test, water levels were recorded at one second intervals with an In-Situ Level TROLL 700 data logger.
For high hydraulic conductivity formations, it's wise to record as many water-level readings per second as possible to ensure capturing rapid response in the well.
On completion of the test, measurements were downloaded from the data logger to a computer using Win-Situ, software that interfaces with the Level TROLL. Win-Situ can export logger data to .csv and .txt files for easy viewing and manipulation. In the next step, you will use Excel to inspect the raw field data.
Field Data Inspection
Before entering data into AQTESOLV, it's a good idea to perform a quick inspection of the raw field data recorded by the data logger.
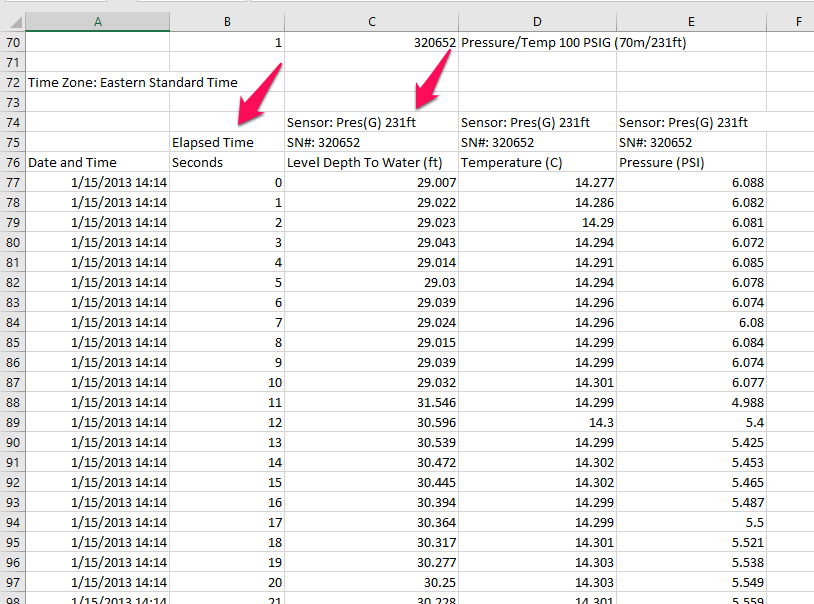
- Use Excel to open the .csv file exported by Win-Situ for this test.
- Scroll past header information at the top of the file and look for sensor measurements arranged in five columns.
- The column labeled Elapsed Time contains elapsed time (in seconds) since the logger began taking readings.
- The adjacent column labeled Depth To Water contains depth to water (in feet) measured from a reference point at the well.
- These are the two columns of data that you will enter into AQTESOLV.
Next create a chart in Excel for a visual inspection of the test data.
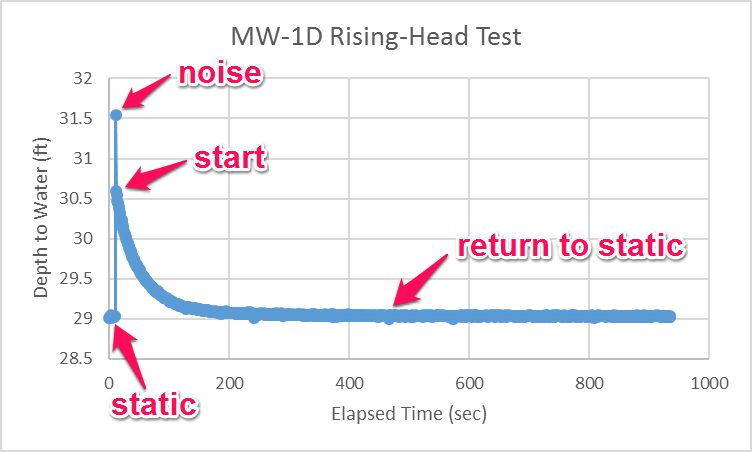
The following information is readily gleaned from the plot of the test data:
- The data logger recorded a few static depth-to-water measurements prior to the initiation of the test. The static depth to water is approximately 29.03 ft.
- The first measurement to follow initiation of the test occurs at 11 seconds when the displacement is 31.546 ft - 29.03 ft = 2.516 ft. This reading, which greatly exceeds the expected initial displacement for the test, is interpreted as having a large component of noise resulting from the sudden removal of the solid slug.
- By the next measurement at 12 seconds, noise associated with test initiation had largely dissipated. At 13 seconds, the displacement in the well, 30.539 ft - 29.03 ft = 1.509 ft, is essentially equal to the expected initial displacement.
- By the end of the test, the depth to water in the control well effectively returned to the static level measured before the test began.
In the next step, you will enter field data from the rising-head slug test into AQTESOLV assuming that the test starts at 13 seconds and the initial displacement in the control well () is 1.509 ft.
The same basic procedure shown above for depth-to-water measurements also applies to transducer readings recorded as depth of sensor (i.e., height of water column above the sensor); however, instead of noting the static depth to water, you would determine the static depth of sensor from pre-test measurements. See our how-to guide for more information.
Data Entry
Begin your interpretation of the slug test data by creating a new AQTESOLV data set. In this example, you will use the Slug Test Wizard to facilitate data entry.
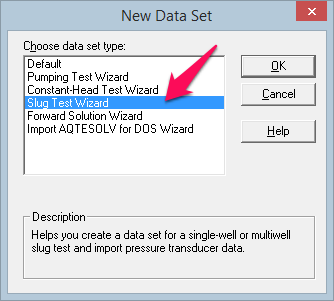
- Start the AQTESOLV application (v4.0 and higher) and choose File > New to create a new data set that will contain data from the slug test. Select Slug Test Wizard to enter data from the slug test. Click OK.
- The Slug Test Wizard prompts you for data required to analyze a slug test. Click Next to begin the wizard.
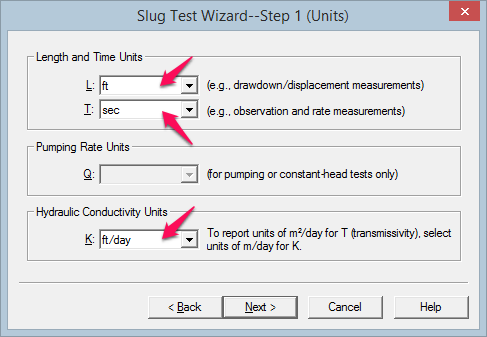
- For the units of measurement, choose ft (feet) for length, sec (seconds) for time and ft/day for hydraulic conductivity. Click Next.
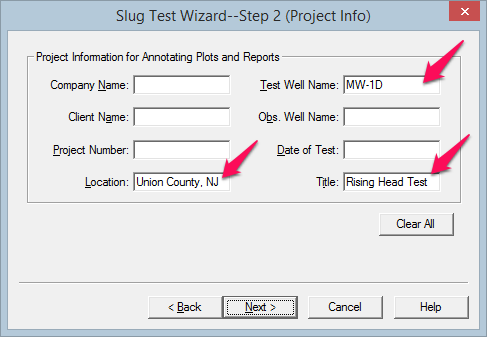
- For project information, enter Union County, NJ for location, MW-1D for test well name and Rising Head Test for title. Click Next.
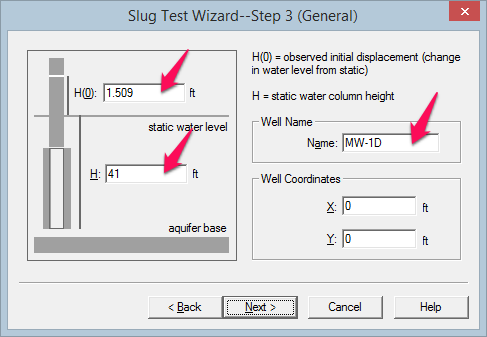
- For general test well data, enter 1.509 for initial displacement, 41 for static water column height and MW-1D for well name. Enter coordinates of X=0 and Y=0. Click Next.
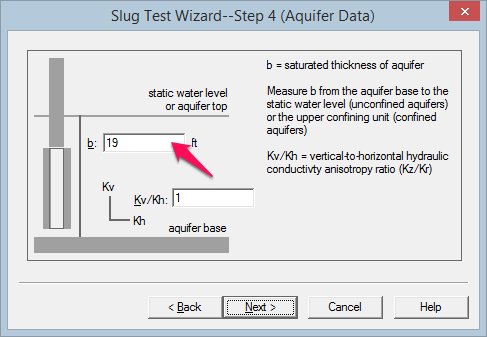
- For aquifer data, enter 19 for aquifer thickness. Assume hydraulic conductivity is isotropic and enter 1 for anisotropy ratio. Click Next.
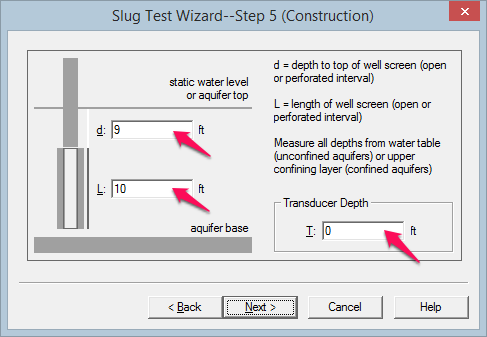
- For construction data, enter 9 for depth to top of screen and 10 for screen length. Assume the transducer measures the position of the water surface in the well and enter 0 for transducer depth. Click Next.
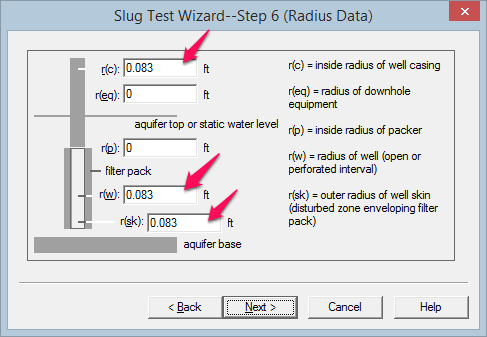
- For radius data, enter 0.083 for casing radius and 0.083 for well radius. Assume no well skin and enter 0.083 for skin radius. Click Next.
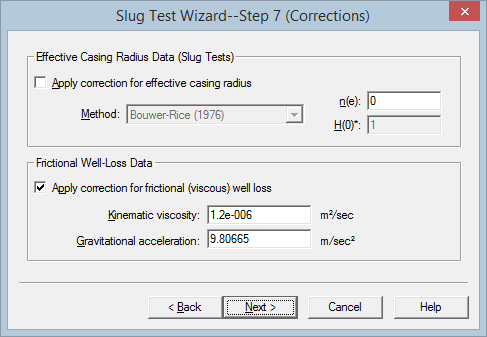
- No corrections are needed for this test. The correction for effective casing radius only applies to wells screened across the water table. Click Next.
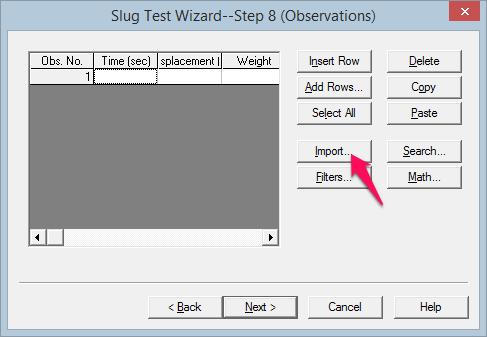
- For observations, import data from the .csv file. Click Import to open the Import Wizard for observation data.
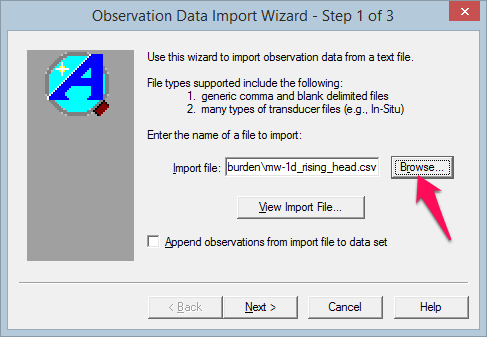
In Step 1 of the Import Wizard, click Browse to select a file to import. Open the file MW-1D_Rising_Head.csv containing the data from the test. Click Next to proceed to Step 2.
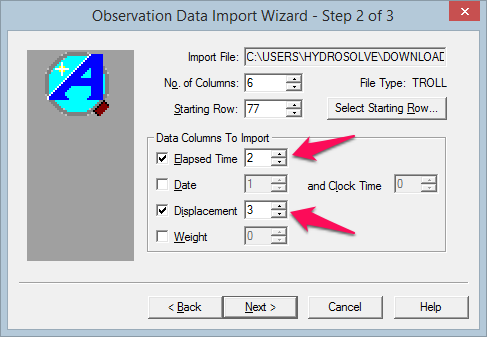
In Step 2 of the Import Wizard, choose columns of data to import from the file. Enter 2 for the column containing elapsed time and 3 for the column containing water levels (displacement). Click Next to proceed to Step 3.
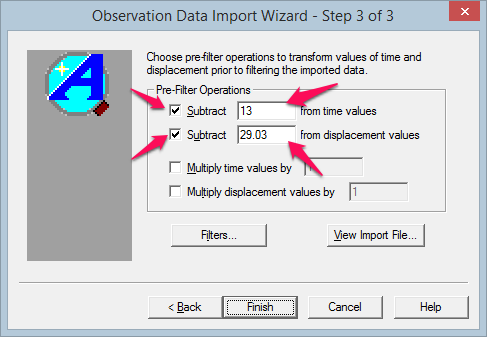
In Step 3 of the Import Wizard, perform data transformations before importing the file. Check the option to subtract 13 seconds from all of the elapsed time values. Check the option to subtract 29.03 feet from all of the displacement values imported from the file. Click Finish to import the data from the file.
Click OK when the Import Wizard is finished.
- Click Next to complete the Slug Test Wizard.
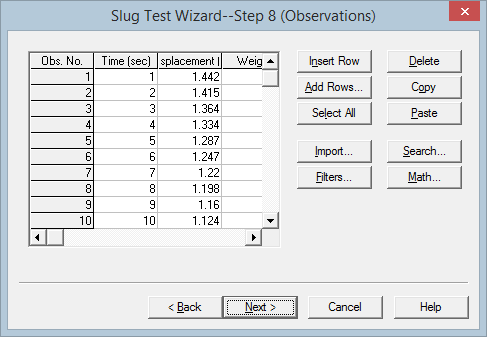
- Click Finish after entering all of the data to finish the Slug Test Wizard.
Upon completion of the wizard, AQTESOLV automatically displays an Error Log that identifies errors in the data set. If the Error Log detects any mistakes, choose options from the Edit menu to correct them.
At this point, it's a good idea to save your work. Save the data set by choosing Save As from the File menu. Choose a folder and enter MW-1D-RH for the name of the file. Click Save. AQTESOLV saves the file with an .aqt extension.
Diagnostics
Following guidelines developed by Butler (1998) for a slug test in a confined aquifer, use the Cooper et al. (1967) method to screen the data.
- Choose Displacement-Time from the View menu to display a plot of the test data.
Displacement is the change in water level in the well from its static (pre-test) position.
- Choose Options from the View menu. In the Plots tab, check Normalized head to display data as normalized head. Click OK.
Normalized head is defined as displacement measured at elapsed time divided by initial displacement, .
- Choose Log-Linear Axes from the View menu.
The data show an inverted sigmoidal shape on these axes that is typical of solutions based on the fully transient overdamped slug test model.
- Choose Format from the View menu. Click the Y Axis tab. Remove the check from Auto and enter 0 for the Min value. Click OK.
- Choose Solution from the Match menu. Remove the check from Solution is inactive. Click the + next to Confined Aquifers to expand the list of available solutions for confined aquifers. Select Cooper-Bredehoeft-Papadopulos (1967) and click OK.
Use the Cooper et al. method as a screening tool to detect wellbore skin and partial penetration effects.
- Choose Automatic from the Match menu and click Estimate to perform automatic curve matching with the Cooper et al. solution.
During the iterative estimation procedure, AQTESOLV displays a progress window and updates the curve displayed on the plot in the background.
When estimation has finished, click OK and then Close. Click OK to view the new position of the type curve.
- The estimated values of transmissivity (T) and storativity (S) from the preliminary Cooper et al. analysis are 71.7 ft2/day and 6×10⁻⁸, respectively.
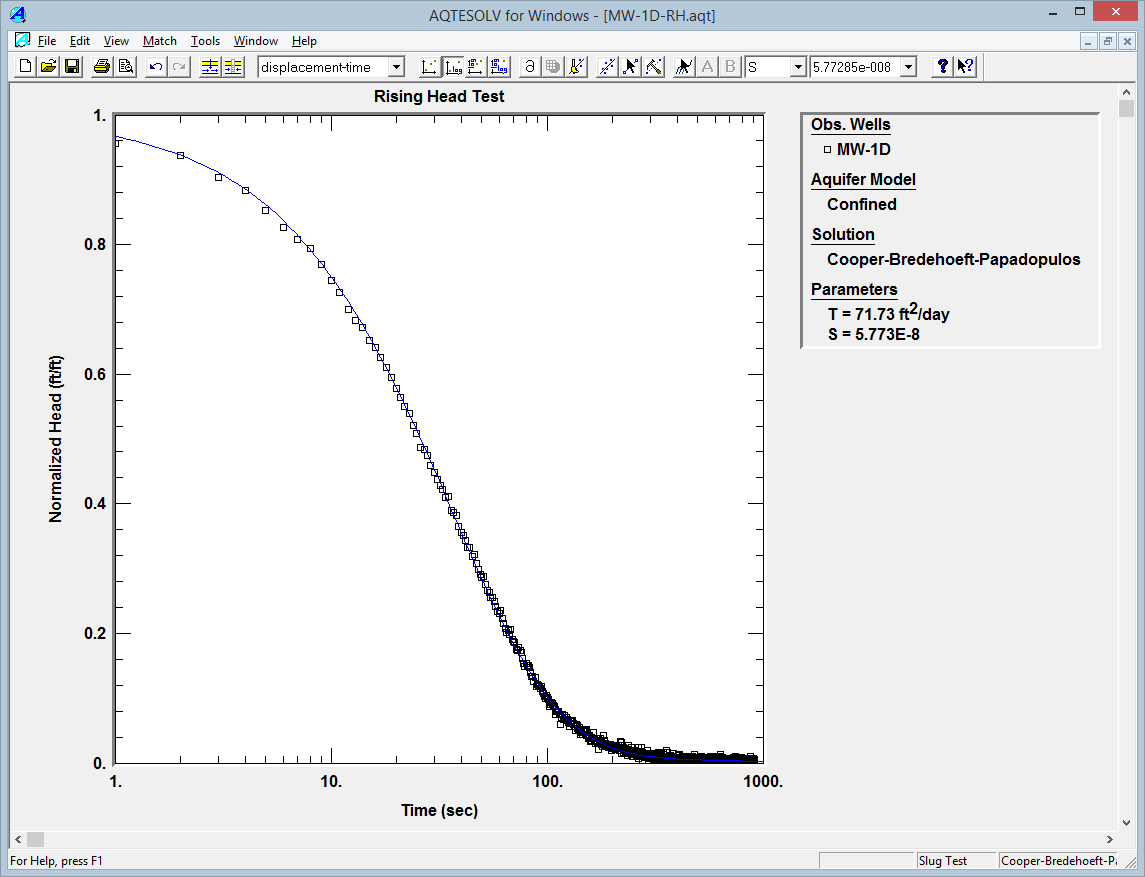
Preliminary analysis using Cooper et al. (1967) solution as a screening tool. Storativity in a confined aquifer typically ranges between 5×10⁻⁵ and 5×10⁻³ (Todd 1980). The implausibly low S determined with the Cooper et al. method suggests wellbore skin or vertical flow due to partial penetration may be important mechanisms (Butler 1998).
Match Solutions
To evaluate the effect of partial penetration, you will now analyze the test data with the Hyder et al. (1994) solution (KGS Model) for a confined aquifer. The KGS Model is a fully transient solution for overdamped slug tests that accounts for elastic storage in the aquifer.
- Choose Solution from the Match menu to select a method for analyzing the data.
- Click the + next to Confined Aquifers to expand the list of available solutions for confined aquifers. Select KGS Model (1994) and click OK.
- Choose Log-Linear Axes from the View menu.
- Choose Automatic from the Match menu and click Estimate to perform automatic curve matching with the KGS Model.
- When estimation is complete, click OK and then Close. Click OK to view the new position of the type curve.
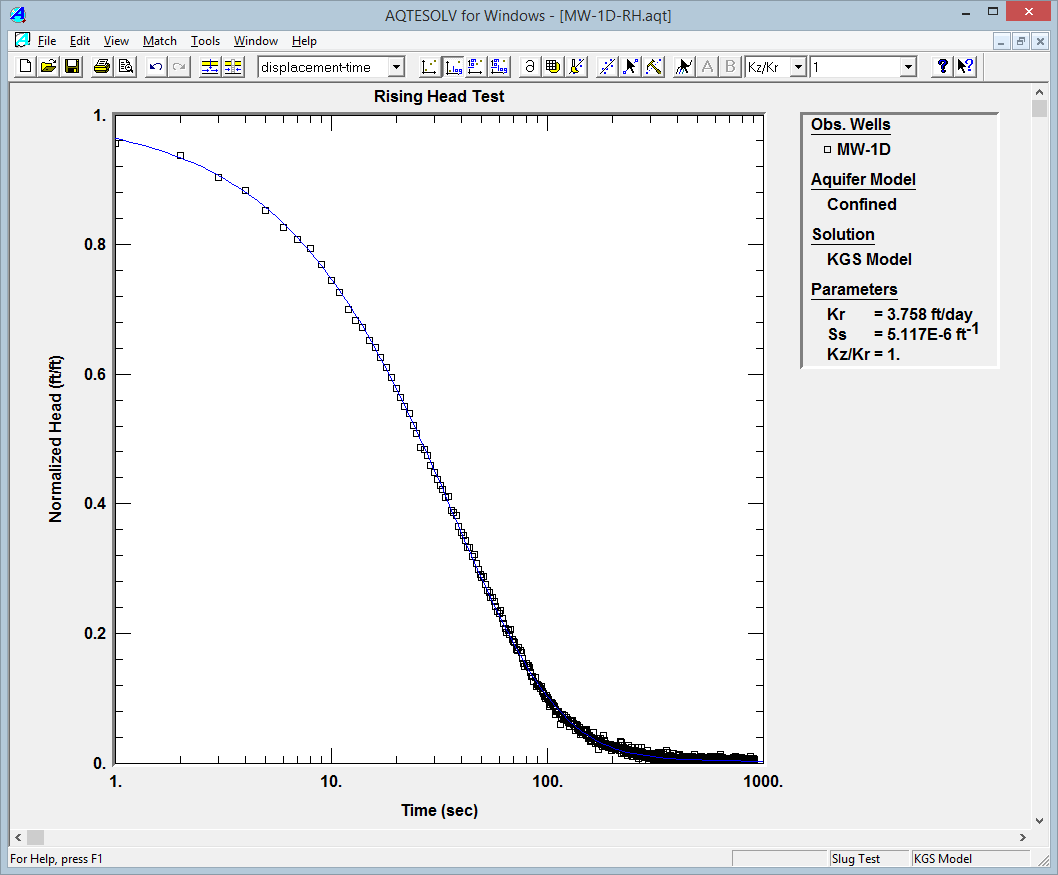
Analysis using KGS Model with partial penetration. The radial hydraulic conductivity (Kr) and specific storage (Ss) are 3.8 ft/day and 5×10⁻⁶ ft-1, respectively. The estimated storativity
is now plausible so we will assume that wellbore skin is not significant.
Next you will use the Hvorslev (1951) solution to analyze the data. The Hvorslev solution is based on a quasi-steady-state slug test model that ignores elastic storage in a confined aquifer. The result will serve as a check on our analysis with the KGS Model.
- Choose Solution from the Match menu to select a method for analyzing the data.
- From the available solutions for Confined Aquifers, select Hvorslev (1951) and click OK.
With the Hvorslev solution, the plot legend shows two parameters: K (hydraulic conductivity) and y0 (intercept of the line on the y axis).
- Choose Options from the View menu. In the Plots tab, check Recommended head range to display the range of normalized head recommended by Butler 1998 for matching the Hvorslev solution. Click OK.
- Choose Visual from the Match menu to perform visual curve matching with the Hvorslev solution.
- To perform visual matching, move the mouse to a point where you wish to begin drawing a new line.
- Click and hold down the left mouse button to anchor the new line at this point.
- Continue to hold the mouse button down and move the mouse to match a new straight line to your data. As you move the mouse, AQTESOLV draws a straight line between the anchor point and the position of the mouse.
- Release the left mouse button when you have finished matching a new straight line. AQTESOLV automatically updates the plot legend to reflect changes in parameter values.
Watch a video to see visual curve matching in action (no sound).
- Repeat the previous step as needed to estimate K by matching the straight line to the data within the recommended head range.
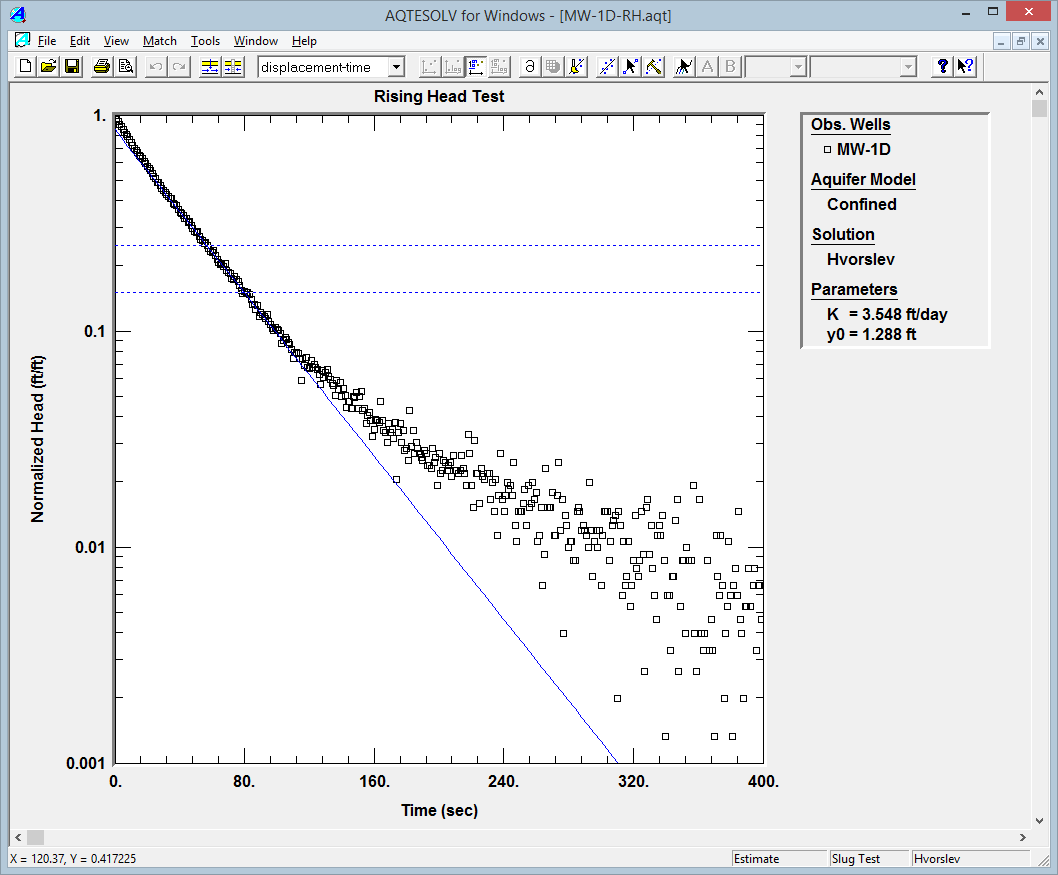
Analysis using Hvorslev (1951) solution matched to recommended head range. The estimated K from the Hvorslev analysis is close (within 6%) to what we obtained with the KGS Model. How does your estimate of K change if you match the straight line to earlier data?
You could use automatic estimation to match the Hvorslev solution to these data; however, visual matching is generally more effective for straight-line solutions because you can apply your judgment to fit the line to the appropriate range of data.
- Select K = 3.8 ft/day from the KGS Model analysis, the more rigorous solution method, for the final result.
- Choose Save from the File menu to save your work.
Did you know? HydroSOLVE, Inc. provides personalized training courses to hone your aquifer test interpretation and AQTESOLV skills.