Constant-Rate Pumping Tests
by Glenn M. Duffield, President, HydroSOLVE, Inc.
What Is A
Constant-Rate Pumping Test?
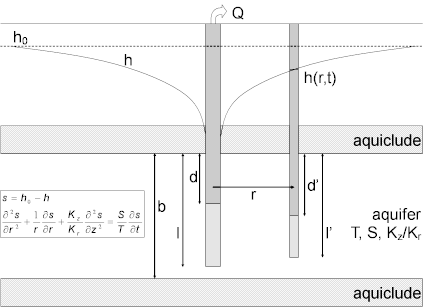
The most common form of pumping test is the constant-rate pumping test in which a control well is pumped at a constant rate and water-level response (drawdown) is measured in one or more surrounding observation wells and optionally in the control well itself.
The goal of a constant-rate pumping test is to estimate hydraulic properties of an aquifer system such as transmissivity, hydraulic conductivity and storativity (storage coefficient).
Methods
Of Analysis
Common methods of interpreting constant-rate pumping tests include the following:
- time-drawdown analysis (s versus t)
- distance-drawdown analysis (s versus r)
- composite plots (s versus t/r²)
Time-Drawdown Analysis
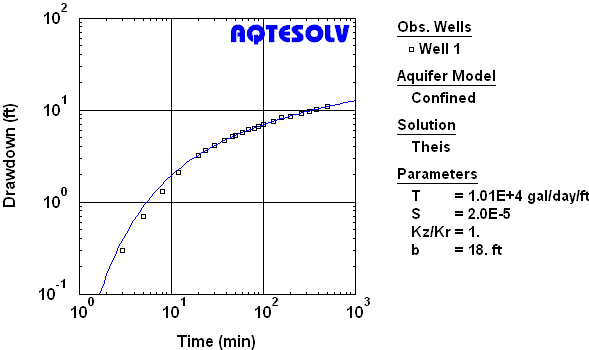
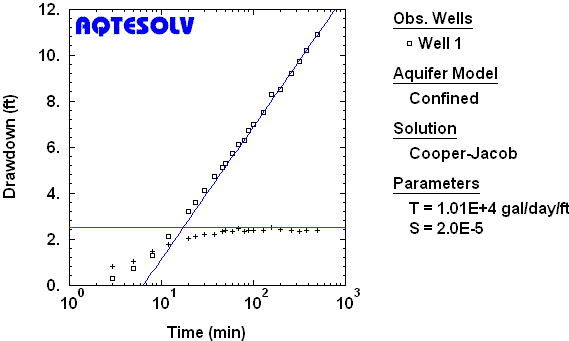
Typically, aquifer properties are estimated from a constant-rate pumping test by fitting mathematical models to drawdown data through a procedure known as curve matching. Curve matching may be performed using type-curve methods on log-log plots (Figure 2) or straight-line methods on semi-log plots (Figure 3).
Distance-Drawdown Analysis
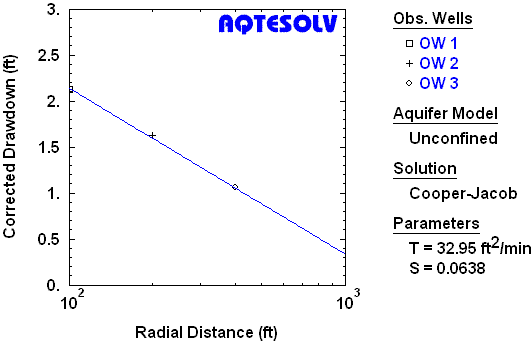
Distance-drawdown plots (drawdown versus radial distance) are used to estimate aquifer properties from pumping tests with more than one observation well. A single drawdown measurement per well, each recorded at the same time, is plotted on a distance-drawdown graph.
Figure 4 shows the estimation of aquifer properties from distance-drawdown data collected at the end of a constant-rate pumping test in an unconfined aquifer using the Cooper and Jacob (1946) straight-line solution.
Composite Plot
The composite plot, another tool for analyzing data from multiwell pumping tests, displays drawdown as a function of t/r² where t is time since pumping began [T], and r is radial distance from pumping well [L].
By normalizing the distance between observation and pumping wells (t/r²), composite plots show data from fully penetrating observation wells matching the same Theis (1935) type curve or the same Cooper and Jacob (1946) straight line when the aquifer conforms to the Theissian model (Figure 5).
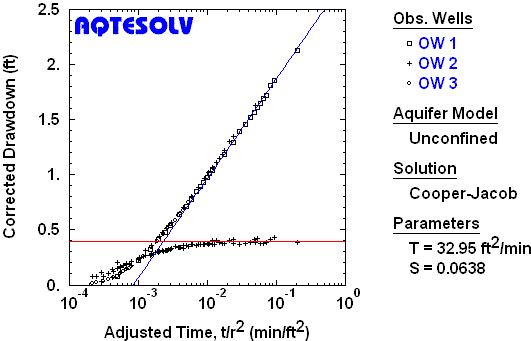
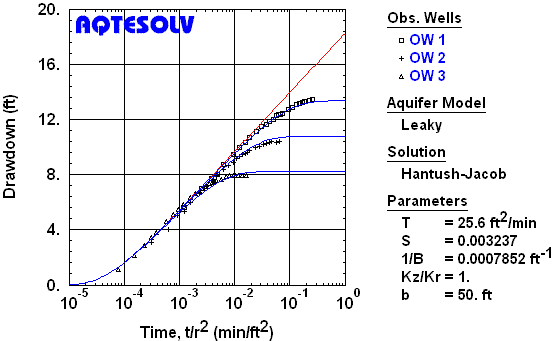
The composite plot is valuable for the analysis of pumping tests that depart from the Theis model, too. Figure 6 shows a composite plot on semi-log axes for a constant-rate pumping test conducted in a leaky confined aquifer (USBR 1995). At early time, the drawdown data from all three observation wells follow the Theis type curve for a nonleaky confined aquifer (shown in red); subsequent deviation from the Theis curve marks the onset of vertical leakage into the pumped aquifer.
