Cooper and Jacob Solution for Confined Aquifers

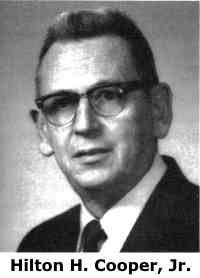
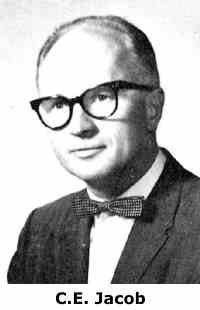
 Hilton Hammond Cooper (1913-1990) and Charles Edward Jacob (1914-1970), groundwater hydrologists with the U.S. Geological Survey, devised a widely used graphical technique for the determination of hydraulic properties (transmissivity and storativity) of nonleaky confined aquifers.
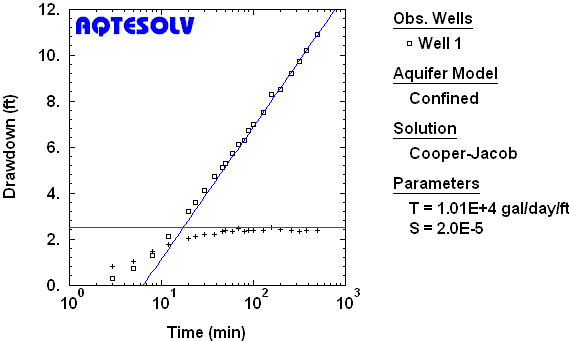
The Cooper and Jacob (1946) solution (sometimes called Jacob's modified nonequilibrium method) is a late-time approximation derived from the Theis type-curve method. Analysis with the Cooper and Jacob method involves matching a straight line to drawdown data plotted as a function of the logarithm of time since pumping began.
Recent advances in well test interpretation have led to the development of a complementary graphical procedure known as derivative analysis which can markedly improve the reliability of the Cooper and Jacob method by more clearly identifying data to match with the straight-line solution.
- If your observation data contain recovery measurements, you may use the Cooper and Jacob method to analyze drawdown data up to the first recovery period.
- You also may use this solution to analyze data from the first recovery period using an Agarwal plot.
- For intermittent pumping (i.e., where the pump cycles on and off), choose the Theis (1935) solution (or any other pumping test solution in AQTESOLV) to analyze the entire set of measurements (i.e., all drawdown and recovery data).
Assumptions
- aquifer has infinite areal extent
- aquifer is homogeneous, isotropic and of uniform thickness
- control well is fully penetrating
- flow to control well is horizontal
- aquifer is nonleaky confined
- flow is unsteady
- water is released instantaneously from storage with decline of hydraulic head
- diameter of a pumping well is very small so that storage in the well can be neglected
- values of are small (i.e., is small and is large)
Equations
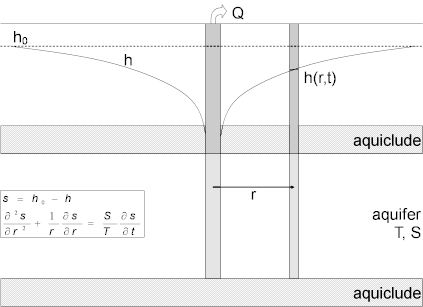
 Cooper and Jacob (1946) derived a modified form of the Theis (1935) solution for transient flow to a well discharging at a constant rate from an homogeneous and isotropic nonleaky confined aquifer of infinite extent and uniform thickness. The Theis equation for drawdown is given in compact notation as follows:
where
- is pumping rate [L³/T]
- is radial distance from pumping well to observation well [L]
- is drawdown [L]
- is storativity [dimensionless]
- is elapsed time since start of pumping [T]
- is transmissivity [L²/T]
- is the Theis well function for nonleaky confined aquifers [dimensionless]
The Theis well function, , in (1) may be evaluated using the following infinite series expression:
where is given in (2). For small values of (i.e., large values of and small values of ), Cooper and Jacob found that the Theis well function may be approximated using only the first two terms in (3):
The critical value of required to achieve reasonable accuracy with the Cooper and Jacob approximation is alternately given as (Driscoll 1986) and (Kruseman and de Ridder 1994). A smaller value for the critical value of leads to a more accurate approximation of the Theis well function.
AQTESOLV includes a graphical feature to verify that u is sufficiently small for proper application of the method.
Combining (1) and (4), Cooper and Jacob approximate drawdown in a nonleaky confined aquifer with the following linear equation:
Converting to decimal logarithms, the Cooper and Jacob equation is as follows:
which is an equation for a line.
To apply the Cooper and Jacob solution in (6), plot as a function of on semi-logarithmic axes and draw a straight line through the data (example). Determine with the following equation:
where
- is the slope of the fitted line (change in drawdown per log cycle time)
With the estimate of obtained from (7), calculate as follows:
where is the intercept of the line on the x axis [T].
Variable-Rate Pumping
For uninterrupted variable-rate pumping, one may use the principle of superposition in time to compute drawdown for constant-rate steps:
where
- is adjusted time [T]
- is pumping rate in the constant-rate step [L³/T]
- is pumping rate in the last constant-rate step prior to recovery [L³/T]
- is pumping rate at elapsed time [L³/T]
- is drawdown at elapsed time [L]
- is adjusted drawdown [L]
- is elapsed time when the constant-rate step starts [T]
The above formulation of the variable-rate Cooper and Jacob solution has the advantage of plotting adjusted drawdown values on the y axis that are within the range of actual drawdown measured during the test instead of the less convenient specific drawdown ().
For a constant-rate test, adjusted time is equal to time since pumping began and adjusted drawdown is equal to drawdown.
The variable-rate implementation of the Cooper and Jacob solution in AQTESOLV equates to the method of Birsoy and Summers (1980).
Radius of Influence
The radius of influence is the radial distance from a pumping well where drawdown is effectively zero for a given time.
Bear (1979) shows that the Cooper and Jacob equation for drawdown leads to the following simple formula for computing the radius of influence, , of a fully penetrating well discharging at a constant rate in an infinite nonleaky confined aquifer:
You may use one of our convenient online calculators to compute radius of influence with the formula in (12).
Data Requirements
- pumping and observation well locations
- pumping rate(s)
- observation well measurements (time and displacement)
The Cooper and Jacob solution is restricted to one pumping well. If your AQTESOLV data set contains multiple pumping wells, the Cooper and Jacob solution only uses the first pumping well for the analysis of observation data.
Solution Options
- pumping rate(s)
- multiple observation wells
Estimated Parameters
AQTESOLV provides visual and automatic methods for matching the Cooper and Jacob modified nonequilibrium method to pumping test data. The estimated aquifer properties are as follows:
- (transmissivity)
- (storativity)
Curve Matching Tips
- Choose Match>Visual to perform visual curve matching using the procedure for straight-line solutions.
- Use parameter tweaking to perform visual curve matching and sensitivity analysis.
- Use derivative analysis to identify drawdown data with a constant slope.
- Choose View>Options to display the critical value of on the plot. Change the critical value in the Valid Time tab.
- Perform visual curve matching prior to automatic estimation to obtain reasonable starting values for the aquifer properties.
- Use Agarwal plots to analyze recovery data.
- You may use the Cooper and Jacob solution to analyze drawdown data from the start of the test up to the first recovery period (a recovery period is any period with a rate equal to zero).
- If your data set contains more than one recovery period, you may use the Cooper and Jacob solution to analyze recovery data in the first recovery period on an Agarwal plot.
- If your data set contains more than one pumping well, AQTESOLV uses the first pumping well in the well data to match test data with the Cooper and Jacob solution.
Benchmark

References
Cooper, H.H. and C.E. Jacob, 1946. A generalized graphical method for evaluating formation constants and summarizing well field history, Am. Geophys. Union Trans., vol. 27, pp. 526-534.
Birsoy, Y.K. and W.K. Summers, 1980. Determination of aquifer parameters from step tests and intermittent pumping, Ground Water, vol. 18, no. 2, pp. 137-146.