Step-Drawdown Tests (Step Tests)
by Glenn M. Duffield, President, HydroSOLVE, Inc.
What Is A
Step-Drawdown Test?
A step-drawdown test (or step test) is a single-well pumping test designed to investigate the performance of a pumping well under controlled variable discharge conditions. In a step-drawdown test, the discharge rate in the pumping well is increased from an initially low constant rate through a sequence of pumping intervals (steps) of progressively higher constant rates. Each step is typically of equal duration, lasting from approximately 30 minutes to 2 hours (Kruseman and de Ridder 1994). Each step should be of sufficient duration to allow dissipation of wellbore storage effects.
In addition to estimating hydraulic properties of an aquifer system such as transmissivity and hydraulic conductivity, the goal of a step-drawdown test is to evaluate well performance criteria such as well loss, well efficiency, wellbore skin factor and effective well radius.

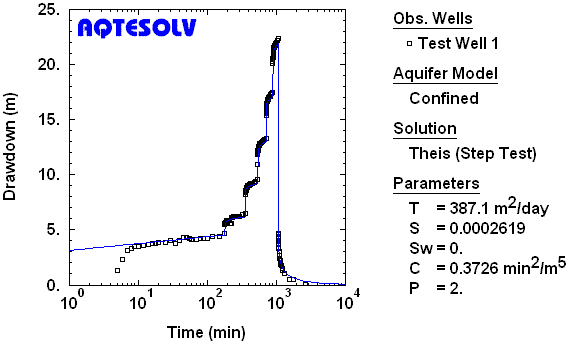
Typically, aquifer properties and well-loss coefficients are estimated from a step-drawdown test by fitting mathematical models (type curves) to drawdown data through a procedure known as curve matching (Figure 1).
Pumping
Rates
Pumping rates used in a step-drawdown test should encompass the maximum design pumping rate for the well (). The following table shows one possible scheme for the pumping rates in a step-drawdown test consisting of four steps:
| Step | Rate |
|---|---|
| 1 | |
| 2 | |
| 3 | |
| 4 |
Well Loss
Equation
Jacob (1947) proposed the following drawdown equation to account for linear and nonlinear head losses in the pumping well at time :
where is drawdown in the pumped well [L], is time since pumping began [T], is a time-dependent linear (laminar) head-loss coefficient [T/L²], is effective radius of the pumped well [L], is pumping rate [L³/T], and is a nonlinear (turbulent) well-loss coefficient [T2/L5].
In Jacob's well loss equation, the terms and are linear well loss and nonlinear well loss, respectively.
The effective well radius, , is defined as the radial distance from the center of the pumped well at which the theoretical drawdown in the aquifer (aquifer loss) is equal to the total linear head loss in the well (i.e., total drawdown in the well neglecting turbulent loss).
Linear Well Loss
The linear head-loss coefficient, , consists of two components, aquifer loss and linear well loss, which Kruseman and de Ridder (1994) define as and , respectively, as follows:
where is the nominal radius of the well [L]. The linear well-loss coefficient, , is assumed independent of time.
For a well experiencing no well loss, Jacob's drawdown equation reduces to aquifer loss:
Ramey (1982) defines the linear well-loss coefficient in terms of a dimensionless wellbore skin factor, , as follows:
where is transmissivity [L²/T].
Assuming nonlinear (turbulent) well loss is negligible, the skin effect is the difference between the total drawdown in the well and the theoretical drawdown (aquifer loss) at the well screen.
A positive skin indicates permeability reduction at the wellbore (e.g., clogging from drilling debris or biofouling). Negative skin suggests permeability enhancement (e.g., stimulation).
The relationship between nominal well radius and effective well radius is given by:
where is nominal well radius [L] and is effective well radius [L]. implies ; implies .
Nonlinear Well Loss
Rorabaugh (1953) modified Jacob's well loss equation to account for variations in the nonlinear well-loss term:
where is the order of nonlinear well losses. According to Rorabaugh (1953), the value of can assume values ranging from 1.5 to 3.5 depending on the value of , but many researchers accept the value of as proposed by Jacob (1947).
When , has the peculiar units of T2/L5. Walton (1962) reported the following interpretation of nonlinear well loss coefficients:
| Well Deterioration |
Nonlinear Well Loss Coefficient, C | |
| sec2/ft5 | sec2/m5 | |
| mild | 5 - 10 | 1900 - 3800 |
| severe | >10 | >3800 |
When , the units for are TP/L3P-1.
Well Efficiency
Well efficiency, which expresses the ratio of aquifer loss (theoretical drawdown) to total (measured) drawdown in the pumped well, is computed from a step-drawdown test as follows (Kruseman and de Ridder 1994):
When the linear and nonlinear well loss terms are zero, .
Solution
Methods
It's a straightforward matter to adapt existing pumping test solutions to the analysis of step-drawdown tests by simply adding the nonlinear well loss term to the drawdown calculated in the pumped well (Bear 1979).
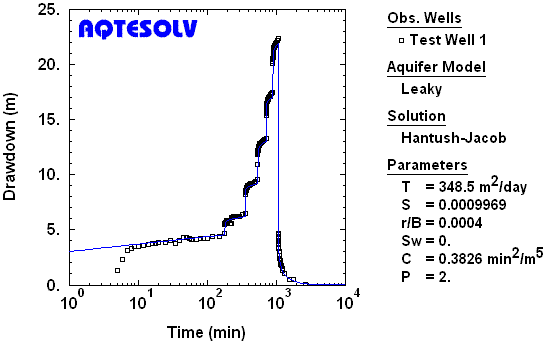
Figure 2 illustrates the application of the Hantush and Jacob (1955) solution for the analysis of a step-drawdown test in a leaky confined aquifer.

Step-drawdown test software like AQTESOLV can simplify your interpretation of data from step tests and provide estimates of well loss, well efficiency, wellbore skin factor and effective well radius.