Overdamped Slug Tests
by Glenn M. Duffield, President, HydroSOLVE, Inc.
What Is An
Overdamped Slug Test?
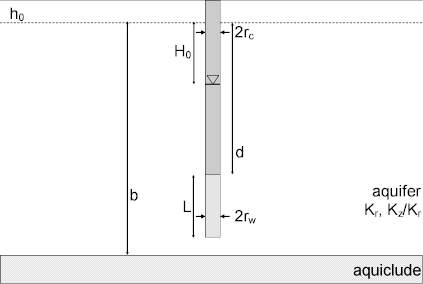
The water-level response (displacement) from a slug test can be classified as either overdamped or underdamped. Overdamped slug tests typically occur in aquifers of low to moderate hydraulic conductivity (K) and exhibit the type of response depicted in Figure 2.
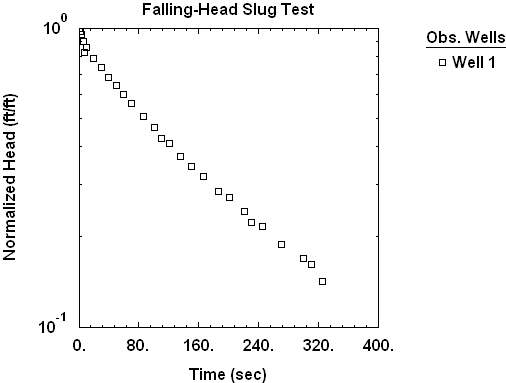
During an overdamped slug test, response data measured in the control well, in the absence of noise, decrease monotonically with increasing time since the start of the test (Figure 2). In contrast, response data from an underdamped slug test exhibit oscillatory behavior.
Most slug tests are carried out as single-well tests, i.e., response data are only collected at the control well. One may reliably estimate hydraulic conductivity (K) from single-well slug tests, but obtaining good estimates of specific storage (Ss) and anisotropy (Kz/Kr) are not viable.
As an alternative to a single-well test one may conduct a multi-well slug test. Using response data from multi-well slug tests, it is possible to obtain reliable estimates of Ss and, in the case of partially penetrating wells, Kz/Kr (Butler 1998)
Methods Of
Data Analysis
Mathematical models such as Bouwer and Rice (1976), Hvorslev (1951) and Cooper et al. (1967) are commonly used to analyze data from overdamped slug tests.
Two categories of graphical methods are available for estimating hydraulic conductivity from overdamped slug test data:
Straight-Line Methods
Hydrogeologists often analyze overdamped single-well slug tests with straight-line graphical methods including Bouwer and Rice (1976) for unconfined aquifers and Hvorslev (1951) for confined aquifers. The mathematical models underlying these straight-line methods ignore formation compressibility and assume quasi-steady-state flow between the well and the formation.
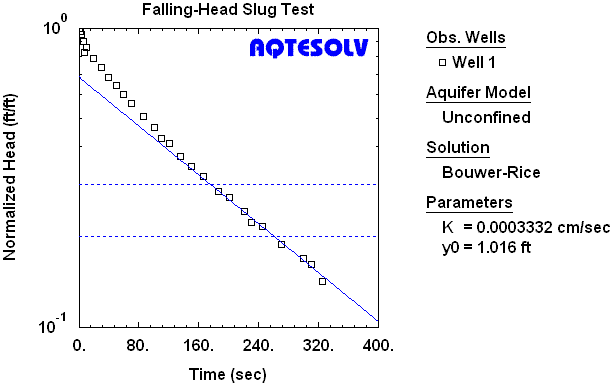
Figure 3 shows the straight-line analysis of an overdamped slug test in a partially penetrating well with a fully submerged well screen using the Bouwer and Rice (1976) method.
Interpretation of slug test data with straight-line methods can be ambiguous when the response data exhibit curvature (e.g., Figure 3). Butler (1998) recommends use of a normalized head range (shown on Figure 3 by two dashed horizontal lines) to enhance the reliability of slug test data analysis with straight-line methods.
Wells screened across the water table depart from assumptions underlying mathematical models for slug test analysis due to filter pack drainage; slug tests in such wells often exhibit a double straight line and may be analyzed with care using the method of Bouwer and Rice (1976).
Type Curve Methods
Type curve methods for the analysis of overdamped single- and multi-well slug tests include Cooper et al. (1967) for confined aquifers and Hyder et al. (1994) for unconfined aquifers. The mathematical models underlying these type-curve methods include formation compressibility and are fully transient.
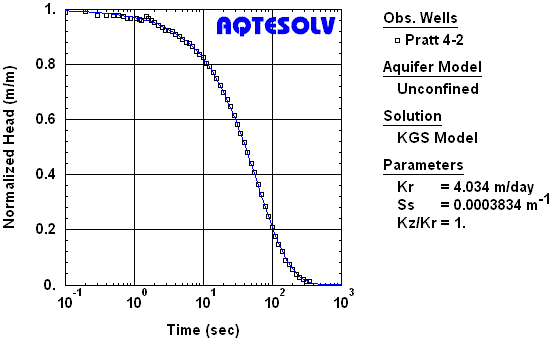
Figure 4 shows the interpretation of an overdamped single-well slug test in a partially penetrating well using the type curve method of Hyder et al. (1994) for an unconfined aquifer. The method assumes that the well is fully submerged below the water table during the test. The estimate of specific storage (Ss) from this analysis appears reasonable which suggests that the results are not strongly impacted by wellbore skin. Estimating anisotropy (Kz/Kr) from this single-well test is not viable and the value of unity was assumed for the analysis.
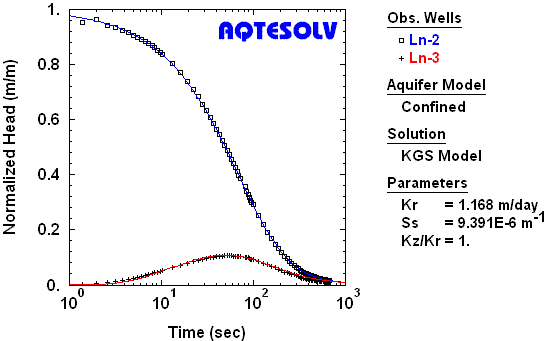
Although the vast majority of slug tests are conducted as single-well tests, interpretation of response data from nearby observation wells is also possible. Figure 5 shows the analysis of response data from the control well (Ln-2) and an observation well (Ln-3). Note that the response data from the observation well do not exhibit the same monotonic behavior as the control well. Unlike single-well slug tests, multi-well tests can provide reliable estimates of Ss and, when wells are partially penetrating, Kz/Kr.