Recommended Normalized Head Range for Slug Test Analysis
by Glenn M. Duffield, President, HydroSOLVE, Inc.
What Are Recommended
Normalized Head Ranges?
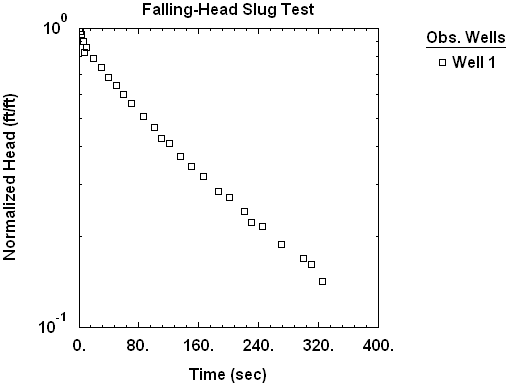
Data from an overdamped slug test in a well with a fully submerged screen may exhibit a concave upward appearance on a plot of log normalized head vs. time (Figure 1). The curvature can make analysis by straight-line methods such as Bouwer and Rice (1976) somewhat ambiguous.

Butler (1998) suggests matching straight-line slug test solutions to data within recommended normalized head ranges to overcome ambiguity associated with data curvature and thereby enhance reliability of data analysis.
Note that a different phenomenon, the so-called double-straight line effect, is sometimes observed in slug test data from wells screened across the water table.
Applying Recommended Normalized Head Ranges
| Solution Method |
Recommended Normalized Head Range for Straight Line Match |
| Hvorslev (1951) | 0.15 to 0.25 |
| Bouwer-Rice (1976) | 0.20 to 0.30 |
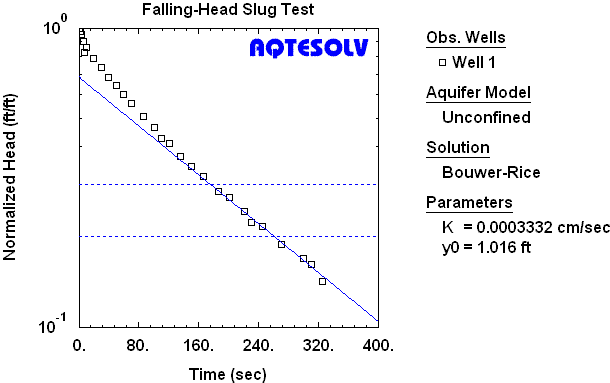
With recommended normalized head ranges to guide us, we can readily match a straight-line solution like Bouwer and Rice (1976) to concave data (Figure 2).

Slug test analysis software can superimpose recommended normalized head ranges on data plots to enhance visual curve matching.