Derivative Analysis
In addition to diagnostic flow plots, AQTESOLV also provides derivative analysis to help you choose appropriate aquifer models and solutions methods for your aquifer test data.
Derivative analysis is a powerful technique popularized in the petroleum industry (Bourdet et al. 1983) that functions as a diagnostic tool and supplements curve matching.
In AQTESOLV, you can perform simultaneous matching of any type-curve solution to both drawdown and derivative data.
What Is The Derivative?
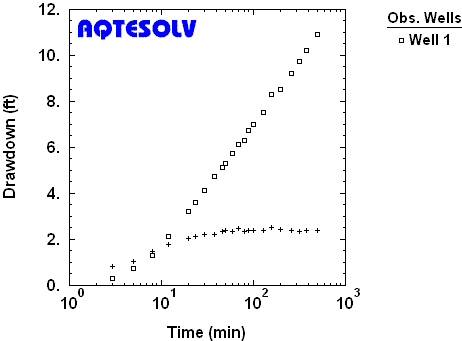
Simply stated, the derivative is the slope of drawdown data plotted on a graph with semilog axes (linear drawdown and logarithmic time).

One important feature identified with a derivative plot is a plateau indicating infinite-acting radial flow (IARF). As illustrated by the example in Figure 1, the derivative reaches this plateau when the Cooper-Jacob straight line method would be appropriate for matching drawdown data to estimate aquifer properties in a nonleaky confined aquifer of infinite extent.
Derivative Plot and Analysis
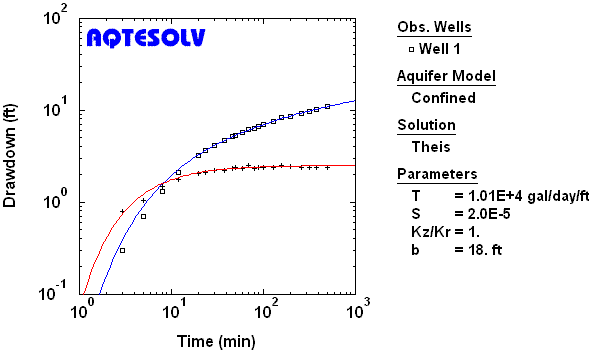
A derivative plot on log-log axes is commonly used for diagnostic interpretation and curve matching.

Figure 2 shows a derivative plot for a pumping test in a nonleaky confined aquifer. You can use interactive visual curve matching to match both curves (drawdown and derivative) simultaneously.
Computation of the derivative requires numerical differentiation of drawdowns. Straightforward calculation of the derivative using neighboring points typically results in noisy data. Consequently, smoothing techniques are employed to reduce noise. AQTESOLV features three smoothing options including the methods of Bourdet et al. (1989) and Spane and Wurstner (1993).
See also: pumping tests, derivative analysis