Theis Step-Drawdown Test Solution for Nonleaky Confined Aquifers
- Assumptions
- Equations
- Data requirements
- Solution options
- Estimated parameters
- Curve matching tips
- Example
- References
Related Solution Methods
Additional Topics

 Theis (1935) developed a mathematical solution for determining the hydraulic properties (transmissivity and storativity) of nonleaky confined aquifers from pumping tests. Hantush (1961a, b; 1964) later introduced equations for partially penetrating wells.
For step-drawdown tests, the Theis/Hantush solution can be easily modified to include linear and nonlinear well losses occurring at the pumping well (Jacob 1947; Rorabaugh 1953; Ramey 1982). Analysis involves matching a curve to drawdown data collected during a step-drawdown test.
Assumptions
- aquifer has infinite areal extent
- aquifer is homogeneous and of uniform thickness
- control well is fully or partially penetrating
- aquifer is nonleaky confined
- flow is unsteady
- water is released instantaneously from storage with decline of hydraulic head
- diameter of pumping well is very small so that storage in the well can be neglected
Equations
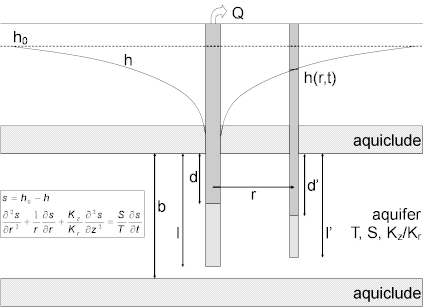
The Theis/Hantush model for a partially penetrating pumping well in an infinite anisotropic nonleaky confined aquifer and adapted for step-drawdown tests to include linear and nonlinear well loss is given by the following equation:
where
- is aquifer thickness [L]
- is nonlinear well loss coefficient [TP/L3P-1]
- is the depth to the top of pumping well screen [L]
- is the radial (horizontal) hydraulic conductivity [L/T]
- is the vertical hydraulic conductivity [L/T]
- is the depth to the bottom of pumping well screen [L]
- is pumping rate [L³/T]
- is well radius [L]
- is drawdown in the pumped well [L]
- is storativity [dimensionless]
- is wellbore skin factor [dimensionless]
- is elapsed time since start of pumping [T]
- is transmissivity [L²/T]
- is the Theis well function for nonleaky confined aquifers [dimensionless]
- is the Hantush and Jacob well function for leaky confined aquifers [dimensionless]
The exponent, , in the nonlinear well loss term, , is generally taken as 2 as originally proposed by Jacob (1947); however, Rorabaugh (1953) postulated that may range between 1.5 and 3.5.
Data Requirements
- pumping and observation well locations
- pumping rate(s)
- observation well measurements (time and displacement)
- partial penetration depths (optional)
- saturated thickness (for partially penetrating wells)
- hydraulic conductivity anisotropy ratio (for partially penetrating wells)
Solution Options
- variable pumping rates
- multiple pumping wells
- multiple observation wells
- partially penetrating pumping and observation wells
Estimated Parameters
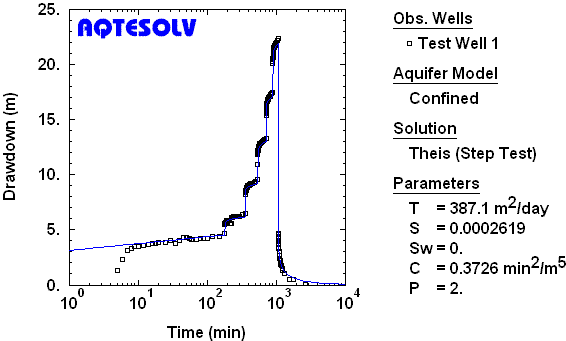
AQTESOLV provides visual and automatic methods for matching the Theis nonequilibrium step-drawdown test method to data from step-drawdown tests. The estimated aquifer properties and well-loss parameters are as follows:
- (transmissivity)
- (storativity)
- (wellbore skin factor)
- (nonlinear well loss coefficient)
- (nonlinear well loss exponent)
Curve Matching Tips
- Use the Cooper and Jacob (1946) solution to obtain preliminary estimates of aquifer properties.
- Choose Match>Visual to perform visual curve matching using the procedure for type curve solutions.
- Use active type curves for more effective visual matching with variable-rate pumping tests.
- Use parameter tweaking to perform visual curve matching and sensitivity analysis.
- Perform visual curve matching prior to automatic estimation to obtain reasonable starting values for the aquifer properties.
- Due to correlation in the equations between (storativity) and (wellbore skin factor), estimate either or for a single-well test but not both as the same time.
Example

References
Theis, C.V., 1935. The relation between the lowering of the piezometric surface and the rate and duration of discharge of a well using groundwater storage, Am. Geophys. Union Trans., vol. 16, pp. 519-524.
Jacob, C.E., 1947. Drawdown test to determine effective radius of artesian well, Trans. Amer. Soc. of Civil Engrs., vol. 112, paper 2321, pp. 1047-1064.
Ramey, H.J., 1982. Well-loss function and the skin effect: A review. In: Narasimhan, T.N. (ed.) Recent trends in hydrogeology, Geol. Soc. Am., special paper 189, pp. 265-271.
Rorabaugh, M.J., 1953. Graphical and theoretical analysis of step-drawdown test of artesian well, Proc. Amer. Soc. Civil Engrs., vol. 79, separate no. 362, 23 pp.